

Introduction
This article shows how to make a 3D Pie chart from a datatable. In business applications, reporting functionality is important.
- Download My Sample
- The Student.sql file will be inside these folders. Execute it in your database.
- USE[master]
- GO
- /****** Object: Table [dbo].[Student] Script Date: 08/17/2012 18:31:11 ******/
- SET ANSI_NULLS ON
- GO
- SET QUOTED_IDENTIFIER ON
- GO
- SET ANSI_PADDING ON
- GO
- CREATE TABLE[dbo].[Student](
- [pk_id][int] IDENTITY(1, 1) NOT NULL, [StudName][varchar](50) NULL, [StudTotal][int] NULL, PRIMARY KEY CLUSTERED(
- [pk_id] ASC) WITH(PAD_INDEX = OFF, STATISTICS_NORECOMPUTE = OFF, IGNORE_DUP_KEY = OFF, ALLOW_ROW_LOCKS = ON, ALLOW_PAGE_LOCKS = ON) ON[PRIMARY]) ON[PRIMARY]
- GO
- SET ANSI_PADDING OFF
- GO
- Change the connection string in web.config file.
- <add name="MyConnection" connectionString="Data Source=MONISH-PC\MONISH;Initial Catalog=master;Persist Security Info=True;User ID=saty;Password=1234" providerName="System.Data.SqlClient"/>
- </connectionStrings>
- Build the Application it will work fine. Read on to learn more!
Building the Sample
- Add New Project and choose Web Forms Application.
- Create a Student table in sql server by executing this sql file: student.sql.
- Add ASP.NET Chart Control to web forms.
- Drag the Chart Control and Gridview Control.
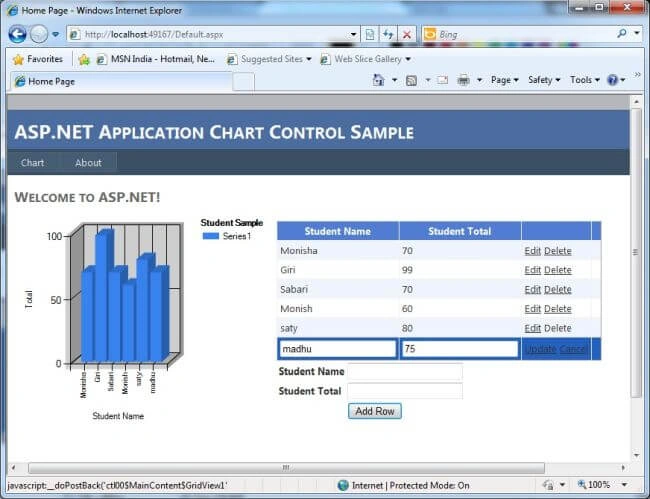
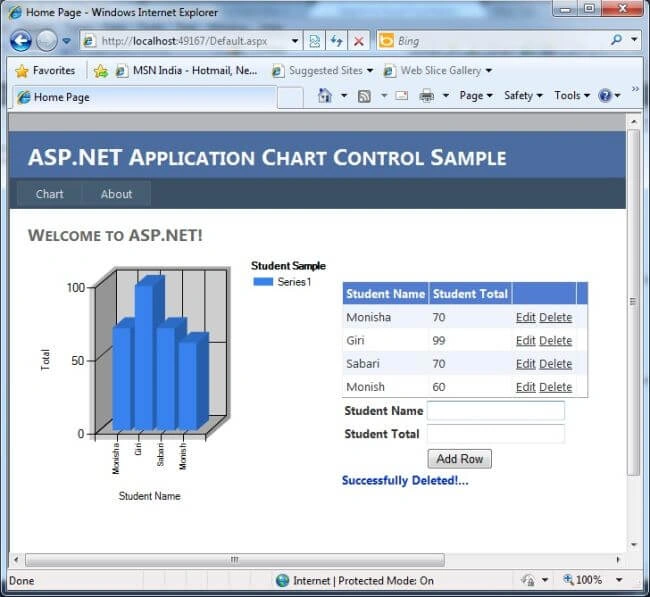
- Use the same model layer with ASP.NET GridView and enable Edit/Delete support of records in SQL server database.
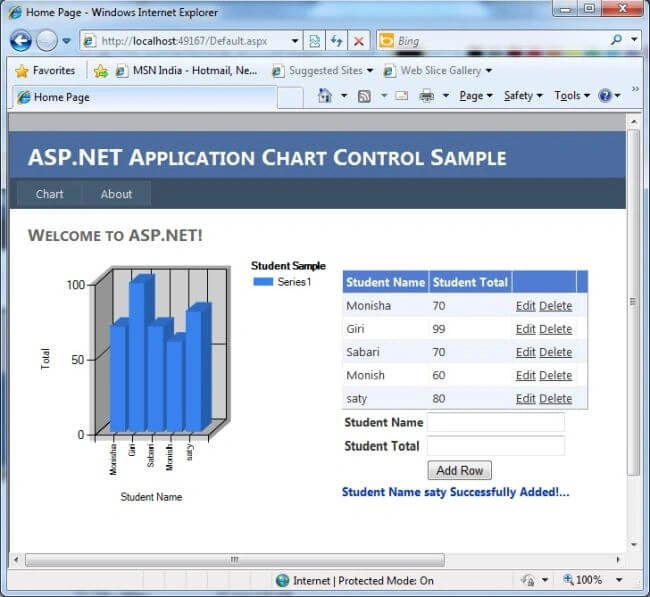
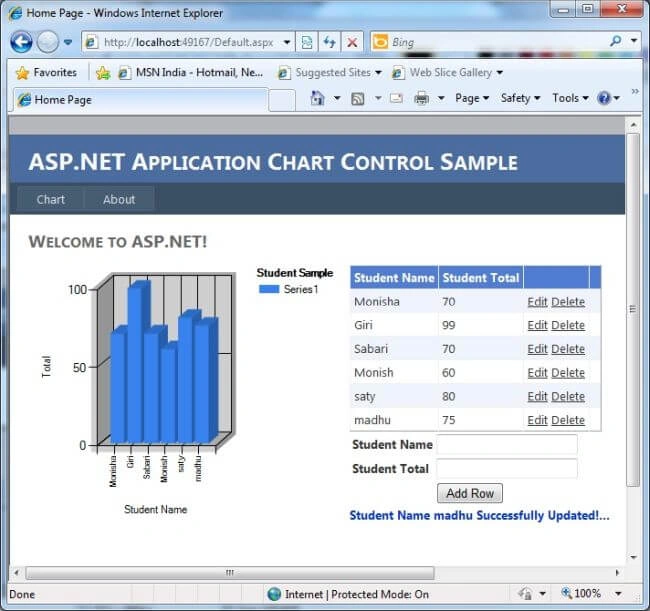
- Reflect the changes in Chart Controls after editing records from GridView.
- Dynamically change ASP.NET 4.0 Chart Control Type.
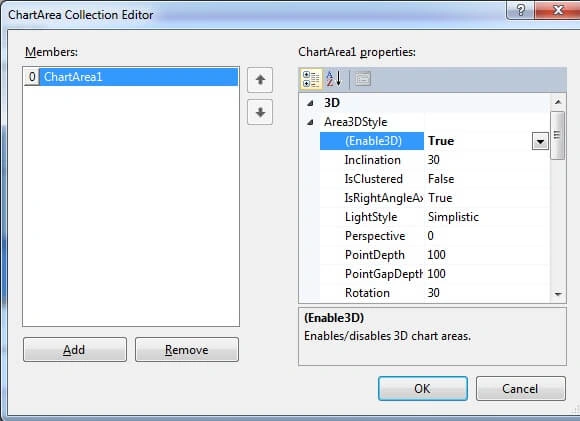
Description
A chart consists of one or more series, which are lists of data points. Typically, each data point is a pair of numbers that provide both the X value and Y value to be plotted. In this sample I coded X value for Student Name and Y Value for Total Marks for particular student.
Source Code Files
- student.sql
More Information
The Microsoft Chart controls make it easy to take data from a database or some other data store and present it as a chart. You can bind an ADO.NET Dataset directly to the Chart.
Satyaprakash SamantarayPosted Mar 21, 2018, 12:10 PM
Nice description.............