

Introduction
In this article, we delve into how Python, with its intuitive syntax and robust libraries like NumPy for numerical computations, SciPy for advanced computing, and Matplotlib for data visualization, is revolutionizing scientific analysis and research. Let's consider a scenario where we analyze a set of temperature data (in Celsius) and visualize the temperature trends.
Step 1. Install the necessary libraries
pip install numpy scipy matplotlibStep 2. Numpy for basic statistics
import numpy as np

# Sample temperature data (in Celsius)
temperatures = np.array([22, 24, 24, 25, 23, 26, 28, 22, 21, 24, 25, 27])

# Calculate basic statistics using NumPy
mean_temp = np.mean(temperatures)
median_temp = np.median(temperatures)

print(f"Mean Temperature: {mean_temp}")
print(f"Median Temperature: {median_temp}")
Step 3. SciPy for mode calculation
from scipy import stats

# Continue using the same temperatures array
mode_result = stats.mode(temperatures)

# Display mode
# The mode_result object contains two arrays: mode and count
# We access the first element of each array safely
if mode_result.count.size > 0:
    print(f"Mode Temperature: {mode_result.mode[0]}")
else:
    print("Mode Temperature: No mode found")
Step 4. MatplotLib for data visualization
import matplotlib.pyplot as plt

# Continue using the same temperatures array

# Create a simple line plot using Matplotlib
plt.plot(temperatures, marker='o')
plt.title('Temperature Trends')
plt.xlabel('Days')
plt.ylabel('Temperature (Celsius)')
plt.grid(True)
plt.show()
Explanation
NumPy is used for handling the temperature data array and calculating basic statistics like mean and median. SciPy's stats module helps in finding the mode, demonstrating its utility in more advanced statistical analysis. Matplotlib creates a line plot, illustrating the temperature trends over the days.
More Complex Data Analysis
# Additional sample data - daily humidity percentages
humidity = np.array([45, 50, 55, 48, 51, 55, 60, 49, 47, 52, 53, 56])

# Correlation Analysis
correlation, _ = stats.pearsonr(temperatures, humidity)
print(f"Correlation between temperature and humidity: {correlation:.2f}")

# Simple Linear Regression
slope, intercept, r_value, p_value, std_err = stats.linregress(temperatures, humidity)
print(f"Linear regression equation: humidity = {slope:.2f} * temperature + {intercept:.2f}")

# Plotting the linear regression line
plt.scatter(temperatures, humidity, color='blue')
plt.plot(temperatures, intercept + slope * temperatures, color='red')
plt.title('Temperature vs Humidity with Linear Regression Line')
plt.xlabel('Temperature (Celsius)')
plt.ylabel('Humidity (%)')
plt.grid(True)
plt.show()

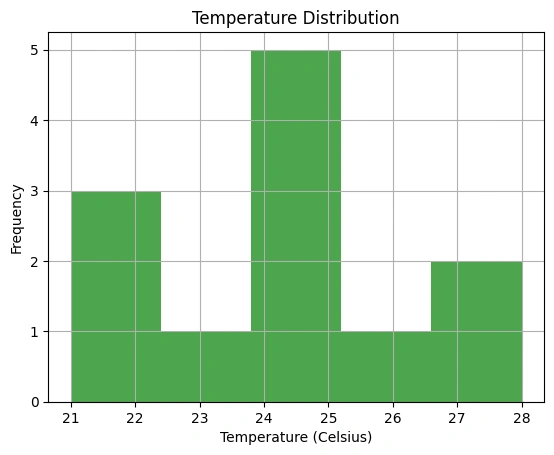
# Histogram for Temperature Data
plt.hist(temperatures, bins=5, alpha=0.7, color='green')
plt.title('Temperature Distribution')
plt.xlabel('Temperature (Celsius)')
plt.ylabel('Frequency')
plt.grid(True)
plt.show()
Output
Correlation between temperature and humidity: 0.85
Linear regression equation: humidity = 1.74 * temperature + 9.66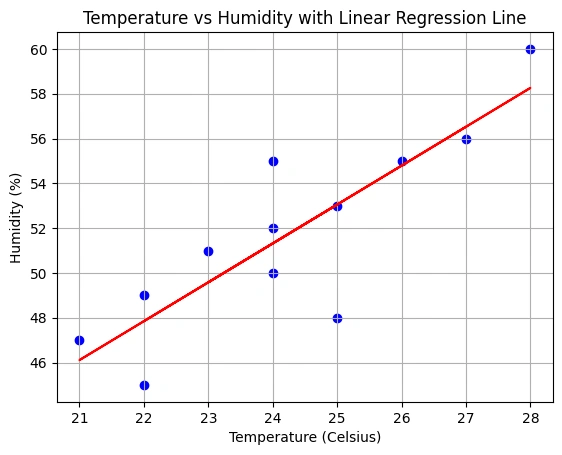
Conclusion
NumPy's efficiency in handling numerical data, SciPy's capabilities in advanced computations, and Matplotlib's ease in visualizing data collectively make Python an indispensable tool for scientists and researchers.
Join the conversation! Your thoughts help the community grow.