

Almost everywhere web and mobile applications are using map. Use of map is increasing day by day to show the geographic data for a user's convenience. A user can find the locations easily using the map. Representation of location is becoming more common in mobile applications as well as in desktop and web applications. If you are looking forward to using a map in your web application, this articles is for you.
Infragistics is one of the companies that provides JavaScript libraries that are easy to use with the JSON data to render the map in your web application. In this article, I will show how can we configure these JavaScript libraries to represent the data on the map.
What will we cover in this article?
- Introduction
- Creating Asp.net Core Empty Project
- Setup MVC
- Types of Maps
- Open Street
- Binding Collection
- Scatter Series
- Symbol Series
- Proportional Symbol Series
- Shapes Series
- Area Series
- Contour Series
- Marker Template
- Polyline Series
- Bing Map
Introduction
Ignite UI for JavaScript map library provides the way to visualize geographic data to your application. It allows rendering the data sets in the form of JSON and other data sources like .shp, dbf, etc consisting of many geographic locations in shapes of markers, lines, polygons, or even interactive bitmaps. This javascript library includes the ability to overlay multiple map layers with geographic data (including data from providers like Bing and Open Street), it allows you to mark specific geographic locations and display information using custom markers and colors.
Creating ASP.NET Core Empty Project
Let’s start the Visual Studio and follow the below steps -
Go to File -> New -> Project -> Choose “Asp.NET Core Web Application”, Set the name of the project and click OK.
Follow the Figure 1. for more details.
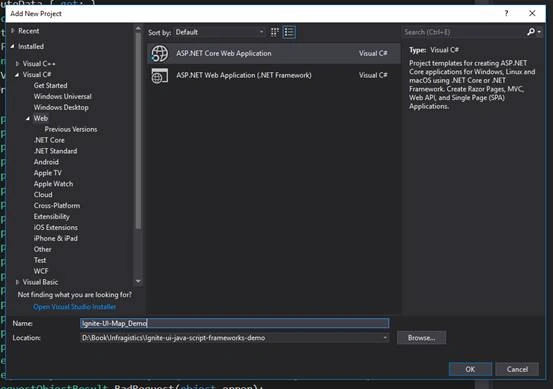
Figure 1.
Select the “Empty Project” and click OK. We are using an empty project to demonstrate how to set up MVC in the empty project.
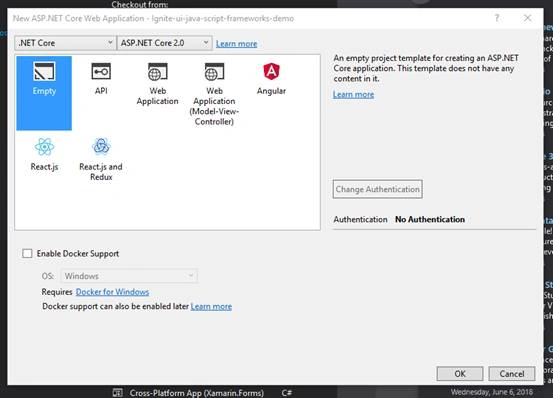
Figure 2.
Now, the project has been created successfully.
Setup MVC
Let’s set up the MVC in the project. Open the solution explorer and right click on the root of the project and add a folder name “Controllers” as shown in Figure 3.
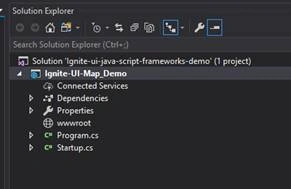
Figure 3.
Add new controller named “HomeController” inside the Controllers folder which will contain all action methods.
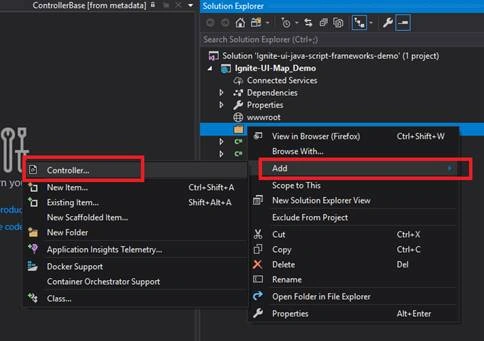
Figure 4.
Select the “MVC Controller - Empty” as shown in Figure 5.
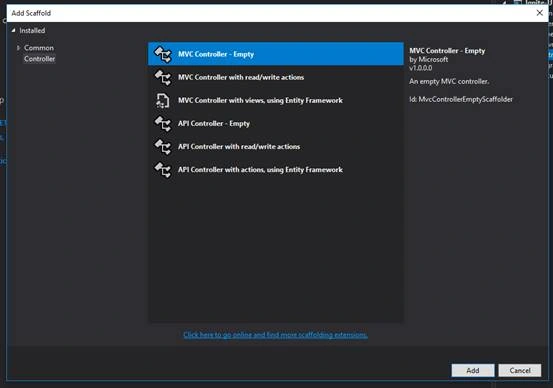
Figure 5.
Set the name for the controller HomeController as shown in Figure 6.
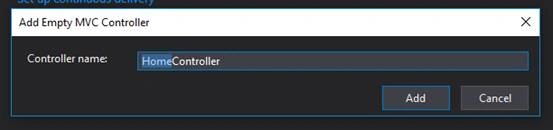
Figure 6.
By default, Visual Studio creates an Index action method for our HomeController but it does not create any View for this action method, so let’s create it.
Right-click on the action method and click “Add View” as shown in Figure 7 and 8.
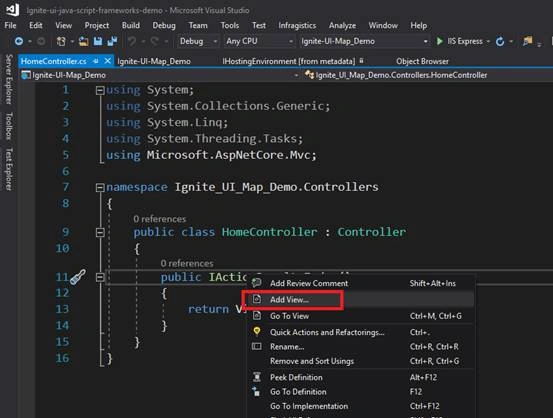
Figure 7.
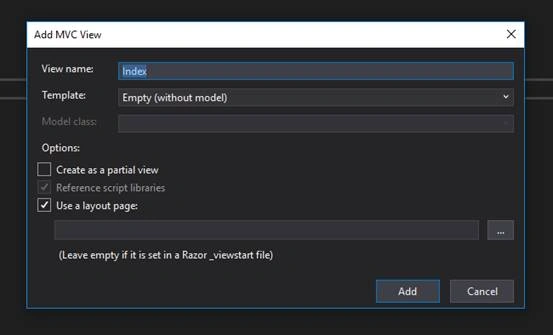
Figure 8.
In the empty project template, Visual Studio does not add the MVC. We need to add it manually and also, we have to set the root controller with default action method so when we run the application, it self-invokes the default controller and runs the index action method.
To do that, open the startup.cs file and add the highlighted code as shown in Listing 1.
- public class Startup
- {
- public void ConfigureServices(IServiceCollection services)
- {
- services.AddMvc();
- }
- public void Configure(IApplicationBuilder app, IHostingEnvironment env)
- {
- app.UseStaticFiles();
- app.UseMvc(routes =>
- {
- routes.MapRoute(
- name: "default",
- template: "{controller=Home}/{action=Index}/{id?}");
- });
- }
- }
Listing 1.
Now, we have set up the MVC in the empty project template. Let’s build the project and run it in the web browser to see if everything is configured properly.
Add the data file in JSON format
To add the data file shown in Listing 2, right click on the “wwwroot” and add the “Cities.js” file inside it and add the below JSON formatted data to it. This data we will use ass geographic location on the map.
- var data = [
- {
- "Name": "Warsaw",
- "Country": "Poland",
- "Latitude": 52.21,
- "Longitude": 21
- },
- {
- "Name": "London",
- "Country": "England",
- "Latitude": 51.50,
- "Longitude": 0.12
- },
- {
- "Name": "Berlin",
- "Country": "Germany",
- "Latitude": 52.50,
- "Longitude": 13.33
- },
- {
- "Name": "Moscow",
- "Country": "Russia",
- "Latitude": 55.75,
- "Longitude": 37.51
- },
- {
- "Name": "Sydney",
- "Country": "Australia",
- "Latitude": -33.83,
- "Longitude": 151.2
- },
- {
- "Name": "Tokyo",
- "Country": "Japan",
- "Latitude": 35.6895,
- "Longitude": 139.6917
- },
- {
- "Name": "Seoul",
- "Country": "South Korea",
- "Latitude": 37.5665,
- "Longitude": 126.9780
- },
- {
- "Name": "Delhi",
- "Country": "India",
- "Latitude": 28.6353,
- "Longitude": 77.2250
- },
- {
- "Name": "Mumbai",
- "Country": "India",
- "Latitude": 19.0177,
- "Longitude": 72.8562
- },
- {
- "Name": "Manila",
- "Country": "Philippines",
- "Latitude": 14.6010,
- "Longitude": 120.9762
- },
- {
- "Name": "Shanghai",
- "Country": "China",
- "Latitude": 31.2244,
- "Longitude": 121.4759
- },
- {
- "Name": "Mexico City",
- "Country": "Mexico",
- "Latitude": 19.4270,
- "Longitude": -99.1276
- },
- {
- "Name": "New York",
- "Country": "United States",
- "Latitude": 40.7561,
- "Longitude": -73.9870
- },
- {
- "Name": "Sao Paulo",
- "Country": "Brasil",
- "Latitude": -23.5489,
- "Longitude": -46.6388
- },
- {
- "Name": "Los Angeles",
- "Country": "United States",
- "Latitude": 34.0522,
- "Longitude": -118.2434
- },
- {
- "Name": "Sofia",
- "Country": "Bulgaria",
- "Latitude": 42.697845,
- "Longitude": 23.321925
- }
- ];
Listing 2.
Add the _Layout.cshtml and _ViewStart.cshtml in the project so we can put all common scripts and CSS in that. See the Figure 9 for more details.
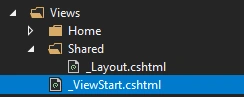
Figure 9.
Add the following Infragistics CSS and Scripts file inside the _Layout.cshtml page.
- <!DOCTYPE html>
- <html>
- <head>
- <meta charset="utf-8" />
- <meta name="viewport" content="width=device-width, initial-scale=1.0" />
- <title>@ViewData["Title"] - Ignite-UI-Maps</title>
- <!-- Ignite UI Required Combined CSS Files -->
- <link href="https://www.igniteui.com/igniteui/css/themes/infragistics/infragistics.theme.css" rel="stylesheet" />
- <link href="https://www.igniteui.com/igniteui/css/structure/infragistics.css" rel="stylesheet" />
- <script src="http://ajax.aspnetcdn.com/ajax/modernizr/modernizr-2.8.3.js"></script>
- <script src="http://code.jquery.com/jquery-1.11.3.min.js"></script>
- <script src="http://code.jquery.com/ui/1.11.1/jquery-ui.min.js"></script>
- <!-- Ignite UI Required Combined JavaScript Files -->
- <script src="http://cdn-na.infragistics.com/igniteui/2018.1/latest/js/infragistics.core.js"></script>
- <script src="http://cdn-na.infragistics.com/igniteui/2018.1/latest/js/infragistics.dv.js"></script>
- <link href="~/CSS/StyleSheet.css" rel="stylesheet" />
- <!-- Used to add markup and provide logging
- functionality for the API Explorer and API Viewer UI -->
- <script src="https://www.igniteui.com/js/apiviewer.js"></script>
- <script id="tooltipTemplate" type="text/x-jquery-tmpl">
- <table id="tooltipTable">
- <tr><th class="tooltipHeading" colspan="2">${item.Name}, ${item.Country}</th></tr>
- <tr>
- <td>Latitude:</td>
- <td>${item.Latitude}</td>
- </tr>
- <tr>
- <td>Longitude:</td>
- <td>${item.Longitude}</td>
- </tr>
- </table>
- </script>
- </head>
- <body>
- <div class="container body-content">
- @RenderBody()
- <hr />
- <footer>
- <p>© @DateTime.Now.Year.ToString() - Ignite-UI-Maps</p>
- </footer>
- </div>
- </body>
- </html>
Listing 3.
Also, add the following CSS here “/CSS/StyleSheet.css”.
- #tooltipTable {
- font-family: Verdana, Arial, Helvetica, sans-serif;
- width: 100%;
- border-collapse: collapse;
- }
- #tooltipTable td, #tooltipTable th {
- font-size: 9px;
- border: 1px solid #b51c1c;
- padding: 3px 7px 2px 7px;
- }
- #tooltipTable th {
- font-weight: bold;
- font-size: 11px;
- text-align: left;
- padding-top: 5px;
- padding-bottom: 4px;
- background-color: #b51c1c;
- color: #ffffff;
- }
Listing 4.
Now, add the “Models” folder and add the “WorldCity.cs” model with the following properties.
- public class WorldCity
- {
- public string Name { get; set; }
- public string Country { get; set; }
- public double Latitude { get; set; }
- public double Longitude { get; set; }
- }
Listing 5.
Types of Infragistics Maps
There are many types of maps provided by Ignite UI, as given below.
Open Street
Add the action method inside the HomeController for OpenStreets map and add the following code.
- public IActionResult OpenStreets()
- {
- return View();
- }
Listing 6.
Now, right click on the OpenStreets action method and click add View to add a view for this action method. A View for OpenStreets will get added at the following location in the project “\Views\Home\OpenStreets.cshtml”.
Add the following HTML and script inside the “OpenStreet.cshtml” for the rendering the Open Street map type.
- <!-- Target element for the map -->
- <div id="map"></div>
- <script src="~/Cities.js"></script>
- <script>
- $(function () {
- $("#map").igMap({
- width: "700px",
- height: "500px",
- windowRect: { left: 0.1, top: 0.1, height: 0.7, width: 0.7 },
- // specifies imagery tiles from OpenStreetMap
- backgroundContent: {
- type: "openStreet"
- },
- series: [{
- type: "geographicSymbol",
- name: "worldCities",
- dataSource: data,
- latitudeMemberPath: "Latitude",
- longitudeMemberPath: "Longitude",
- markerType: "automatic",
- markerCollisionAvoidance: "fade",
- markerOutline: "#b51c1c",
- markerBrush: "#b51c1c",
- showTooltip: true,
- tooltipTemplate: "tooltipTemplate"
- }]
- });
- $("#map").find(".ui-widget-content").append("<span class='copyright-notice'><a href='https://www.openstreetmap.org/copyright'>© OpenStreetMap contributors</a></span>")
- });
- </script>
Listing 7.
Also, add the ActionLink on the Index.cshtml page to access the Open Streets View.
- @{
- ViewData["Title"] = "Index";
- }
- <h2>Types of Maps</h2>
- <ul>
- <li>
- <a href="@Url.Action("OpenStreets", "Home")">
- Open Streets
- </a>
- </li>
- </ul>
Listing 8.
Now, run the application in a web browser and open the page.
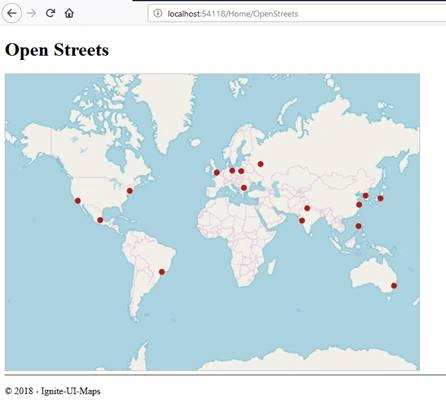
Figure 10.
Binding Collection
Add the action method inside the HomeController for BindingCollection Map and add the following code.
- public IActionResult BindingCollection()
- {
- // Get the content of the world-cities.js file and extract the array data only
- // excluding the opening variable declaration
- var jsFileName = Path.Combine(env.WebRootPath, "Cities.js");
- var jsFileContent = System.IO.File.ReadAllText(jsFileName);
- var openingBracePos = jsFileContent.IndexOf('[');
- var closingBracePos = jsFileContent.IndexOf(']');
- var jsonContent = jsFileContent.Substring(openingBracePos, closingBracePos - openingBracePos + 1);
- // De-serialize WorldCities data from a JavaScript array into List<WorldCity>
- var wordlCities = Newtonsoft.Json.JsonConvert.DeserializeObject<List<WorldCity>>(jsonContent);
- return View("BindingCollection", wordlCities.AsQueryable());
- }
Listing 9.
Now, right click on the BindingCollection action method and click add View to add a view for this action method. A View for BindingCollection will get added at the following location in the project “\Views\Home\BindingCollection.cshtml”.
Add the following HTML and script inside the “BindingCollection.cshtml” for rendering the Binding Collection map type.
- @using Infragistics.Web.Mvc;
- @model IQueryable<Ignite_UI_Map_Demo.Models.WorldCity>
- <div>
- @(Html.Infragistics().Map<Ignite_UI_Map_Demo.Models.WorldCity>(Model)
- .ID("map")
- .Width("700px")
- .Height("500px")
- .OverviewPlusDetailPaneVisibility(Visibility.Visible)
- .OverviewPlusDetailPaneBackgroundImageUri(Url.Content("~/images/samples/maps/World.png"))
- .BackgroundContent(bgr => bgr.OpenStreetMaps())
- .PanModifier(ModifierKeys.Control)
- .Series(series =>
- {
- series.GeographicSymbol("worldCities")
- .LatitudeMemberPath(item => item.Latitude)
- .LongitudeMemberPath(item => item.Longitude)
- .MarkerType(MarkerType.Automatic)
- .MarkerCollisionAvoidance(CollisionAvoidanceType.Fade)
- .MarkerBrush("#1B559D")
- .MarkerOutline("black")
- .ShowTooltip(true).TooltipTemplate("tooltipTemplate");
- })
- .WindowRect(0.1, 0.1, 0.7, 0.7)
- .DataBind()
- .Render()
- )
- </div>
- <script type="text/javascript">
- $(function () {
- $("#map").find(".ui-widget-content")
- .append("<span class='copyright-notice'><a href='http://www.openstreetmap.org/copyright'>© OpenStreetMap contributors</a></span>");
- });
- </script>
Listing 10.
Also, add the ActionLink on the Index.cshtml page to access the Binding Collection view.
- @{
- ViewData["Title"] = "Index";
- }
- <h2>Types of Maps</h2>
- <ul>
- <li>
- <a href="@Url.Action("BindingCollection", "Home")">
- Binding Collection
- </a>
- </li>
- </ul>
Listing 11.
Now, run the application in the web browser and open the page.
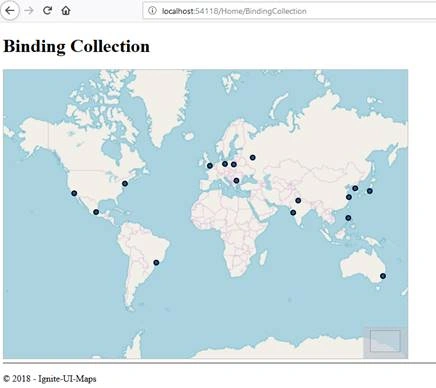
Figure 11.
Scatter Series
Add the action method inside the Home Controller for ScatterSeries map and add the following code.
- public IActionResult ScatterSeries()
- {
- return View();
- }
Listing 12.
Now right click on the ScatterSeries action method and click add View to add a view for this action method. A View for ScatterSeries will get added at the following location in the project “\Views\Home\ScatterSeries.cshtml”.
Add the following HTML and script inside the “ScatterSeries.cshtml” for the rendering the Scatter Series map type.
- @{
- ViewData["Title"] = "ScatterSeries";
- }
- <style type="text/css">
- .sliderBounds {
- width: 95px;
- margin: 6px 3px 6px 6px;
- display: inline-block;
- }
- .optionContainer {
- width: 200px;
- margin: 2px;
- padding: 2px;
- display: inline-block;
- border: 1px solid #e0e0e0;
- -moz-border-radius: 4px;
- -webkit-border-radius: 4px;
- border-radius: 4px;
- }
- .selectBounds {
- min-width: 120px;
- max-width: 132px;
- }
- </style>
- <h2>Scatter Series</h2>
- <script src="https://www.igniteui.com/data-files/high-density-data.js"></script>
- <script id="cityTemplate" type="text/x-jquery-tmpl">
- <table>
- <tr><td class="tooltipHeading" colspan="2">${item.name}</td></tr>
- </table>
- </script>
- <style type="text/css">
- .sliderBounds {
- width: 95px;
- margin: 6px 3px 6px 6px;
- display: inline-block;
- }
- .optionContainer {
- width: 200px;
- margin: 2px;
- padding: 2px;
- display: inline-block;
- border: 1px solid #e0e0e0;
- -moz-border-radius: 4px;
- -webkit-border-radius: 4px;
- border-radius: 4px;
- }
- .selectBounds {
- min-width: 120px;
- max-width: 132px;
- }
- </style>
- <div id="map"></div>
- <br />
- <div>
- <fieldset id="chartOptions">
- <legend>Map Options</legend>
- <br />
- <div class="optionContainer">
- Resolution
- <br />
- <div id="resolutionSlider" class="sliderBounds"></div>
- <label id="resolutionLabel">0</label>
- </div>
- <div class="optionContainer">
- Minimum Heat Value
- <br />
- <div id="minimumHeatValueSlider" class="sliderBounds"></div>
- <label id="minimumHeatValueLabel">0</label>
- </div>
- <div class="optionContainer">
- Maximum Heat Value
- <br />
- <div id="maximumHeatValueSlider" class="sliderBounds"></div>
- <label id="maximumHeatValueLabel">5</label>
- </div>
- <br />
- <div class="optionContainer">
- Point Extent
- <br />
- <div id="pointExtentSlider" class="sliderBounds"></div>
- <label id="pointExtentLabel">1</label>
- </div>
- <div class="optionContainer">
- Minimum Heat Color
- <br />
- <select id="minimumHeatColorDropDown" class="selectBounds">
- <option value="red">Red</option>
- <option value="blue">Blue</option>
- <option value="green">Green</option>
- <option value="yellow">Yellow</option>
- <option value="black" selected="selected">Black</option>
- </select>
- </div>
- <div class="optionContainer">
- Maximum Heat Color
- <br />
- <select id="maximumHeatColorDropDown" class="selectBounds">
- <option value="red" selected="selected">Red</option>
- <option value="blue">Blue</option>
- <option value="green">Green</option>
- <option value="yellow">Yellow</option>
- <option value="black">Black</option>
- </select>
- </div>
- <br />
- <div class="optionContainer">
- <input type="checkbox" id="enableMouseOverCheckBox" checked="checked" />Enable Mouse Over<br />
- </div>
- <div class="optionContainer">
- <input type="checkbox" id="useBruteForceCheckBox" />Use Brute Force<br />
- </div>
- </fieldset>
- </div>
- <br />
- <script type="text/javascript">
- $(function () {
- $("#map").igMap({
- width: "700px",
- height: "500px",
- backgroundContent: {
- type: "openStreet"
- },
- series: [{
- type: "geographicHighDensityScatter",
- name: "australiaMap",
- dataSource: placeData,
- latitudeMemberPath: "lat",
- longitudeMemberPath: "lon",
- heatMinimum: 0,
- heatMaximum: 5,
- mouseOverEnabled: true,
- showTooltip: true,
- tooltipTemplate: "cityTemplate"
- }],
- windowRect: {
- left: 0.7,
- top: 0.52,
- width: 0.127,
- height: 0.127
- }
- });
- $("#map").find(".ui-widget-content").append("<span class='copyright-notice'><a href='https://www.openstreetmap.org/copyright'>© OpenStreetMap contributors</a></span>");
- // Resolution
- $("#resolutionSlider").slider({
- min: 0,
- max: 10,
- value: 0,
- slide: function (event, ui) {
- $("#map").igMap("option", "series", [{ name: "australiaMap", resolution: ui.value }]);
- $("#resolutionLabel").text(ui.value);
- }
- });
- // Minimum Heat Value
- $("#minimumHeatValueSlider").slider({
- min: 0,
- max: 5,
- value: 0,
- slide: function (event, ui) {
- $("#map").igMap("option", "series", [{ name: "australiaMap", heatMinimum: ui.value }]);
- $("#minimumHeatValueLabel").text(ui.value);
- }
- });
- // Maximum Heat Value
- $("#maximumHeatValueSlider").slider({
- min: 5,
- max: 10,
- value: 10,
- slide: function (event, ui) {
- $("#map").igMap("option", "series", [{ name: "australiaMap", heatMaximum: ui.value }]);
- $("#maximumHeatValueLabel").text(ui.value);
- }
- });
- // Heat Minimum Color
- $("#minimumHeatColorDropDown").on({
- change: function (e) {
- var minColor = $(this).val();
- $("#map").igMap("option", "series", [{ name: "australiaMap", heatMinimumColor: minColor }]);
- }
- });
- // Heat Maximum Color
- $("#maximumHeatColorDropDown").on({
- change: function (e) {
- var maxColor = $(this).val();
- $("#map").igMap("option", "series", [{ name: "australiaMap", heatMaximumColor: maxColor }]);
- }
- });
- // Point Extent
- $("#pointExtentSlider").slider({
- min: 1,
- max: 5,
- value: 1,
- slide: function (event, ui) {
- $("#map").igMap("option", "series", [{ name: "australiaMap", pointExtent: ui.value }]);
- $("#pointExtentLabel").text(ui.value);
- }
- });
- // Enable Mouse Over
- $("#enableMouseOverCheckBox").click(function (e) {
- var enableMouseOverSeries = $("#enableMouseOverCheckBox").is(":checked") ? true : false;
- $("#map").igMap("option", "series", [{ name: "australiaMap", mouseOverEnabled: enableMouseOverSeries }]);
- });
- // Use Brute Force
- $("#useBruteForceCheckBox").click(function (e) {
- var useBruteForceSeries = $("#useBruteForceCheckBox").is(":checked") ? true : false;
- $("#map").igMap("option", "series", [{ name: "australiaMap", useBruteForce: useBruteForceSeries }]);
- });
- });
- </script>
Listing 13.
Also, add the ActionLink on the Index.cshtml page to access the Scatter Series view.
- @{
- ViewData["Title"] = "Index";
- }
- <h2>Types of Maps</h2>
- <ul>
- <li>
- <a href="@Url.Action("ScatterSeries", "Home")">
- Scatter Series
- </a>
- </li>
- </ul>
Listing 14.
Now, run the application in the web browser and open the page.
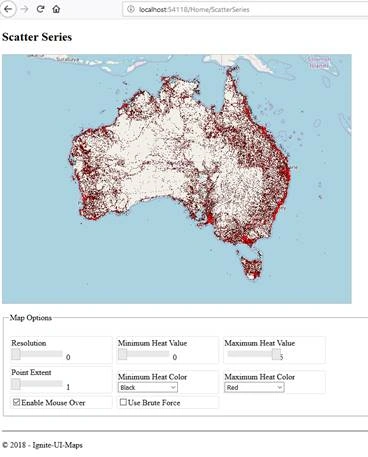
Figure 12.
Symbol Series
Add the action method inside the HomeController for SymbolSeries Map and add the following code.
- public IActionResult SymbolSeries()
- {
- return View();
- }
Listing 15.
Now, right click on the SymbolSeries action method and click "Add View" to add a view for this action method. A View for SymbolSeries will get added at the following location in the project “\Views\Home\SymbolSeries.cshtml”.
Add the following HTML and script inside the “SymbolSeries.cshtml” for the rendering the Symbol Series map type.
- @{
- ViewData["Title"] = "SymbolSeries";
- }
- <script src="https://www.igniteui.com/js/map-helper.js" type="text/javascript"></script>
- <style>
- #tooltipTable {
- font-family: Verdana, Arial, Helvetica, sans-serif;
- width: 100%;
- border-collapse: collapse;
- }
- #tooltipTable td, #tooltipTable th {
- font-size: 9px;
- border: 1px solid #5da7df;
- padding: 3px 7px 2px 7px;
- }
- #tooltipTable th {
- font-weight: bold;
- font-size: 11px;
- text-align: left;
- padding-top: 5px;
- padding-bottom: 4px;
- background-color: #5da7df;
- color: #ffffff;
- }
- </style>
- <script id="geoSymbolTooltip" type="text/x-jquery-tmpl">
- <table id="tooltipTable">
- <tr><th colspan="2">${item.City}, ${item.Country}</th></tr>
- <tr>
- <td>Population:</td>
- <td>${item.Population}</td>
- </tr>
- </table>
- </script>
- <h2>Symbol Series</h2>
- <script type="text/javascript">
- $(function () {
- // load geo-locations from shapefile and simplify data structure
- var worldCities = [];
- var points = [];
- var shapeDataSource = new $.ig.ShapeDataSource({
- shapefileSource: "https://www.igniteui.com/data-files/shapes/world_cities.shp",
- databaseSource: "https://www.igniteui.com/data-files/shapes/world_cities.dbf",
- transformRecord: function (rec) {
- var pointX = rec.points.item(0).item(0).x();
- var pointY = rec.points.item(0).item(0).y();
- var city = rec.fields.item("NAME");
- var country = rec.fields.item("COUNTRY");
- var population = rec.fields.item("POPULATION");
- if (population > 7000) {
- points.push({
- Latitude: pointY, Longitude: pointX,
- City: city, Country: country,
- Population: population
- });
- }
- },
- callback: function () {
- worldCities = points.sort(compareCities);;
- createMap();
- }
- });
- shapeDataSource.dataBind();
- function compareCities(a, b) {
- if (a.Population > b.Population)
- return -1;
- if (a.Population < b.Population)
- return 1;
- return 0;
- }
- function createMap() {
- $("#map").igMap({
- width: "700px",
- height: "500px",
- windowRect: { left: 0.1, top: 0.1, height: 0.7, width: 0.7 },
- overviewPlusDetailPaneVisibility: "visible",
- overviewPlusDetailPaneBackgroundImageUri: "https://www.igniteui.com/images/samples/maps/world.png",
- backgroundContent: {
- type: "openStreet"
- },
- series: [{
- type: "geographicSymbol",
- name: "worldCities",
- dataSource: worldCities,
- longitudeMemberPath: "Longitude",
- latitudeMemberPath: "Latitude",
- showTooltip: true,
- tooltipTemplate: "geoSymbolTooltip",
- // using custom template
- markerType: "none",
- markerTemplate: {
- measure: function (measureInfo) {
- measureInfo.width = 10;
- measureInfo.height = 10;
- },
- render: function (renderInfo) {
- var ctx = renderInfo.context;
- var x = renderInfo.xPosition;
- var y = renderInfo.yPosition;
- if (renderInfo.isHitTestRender)
- ctx.fillStyle = renderInfo.data.actualItemBrush().fill();
- else
- ctx.fillStyle = "black";
- var size = 10;
- var heightHalf = size / 2.0;
- var widthHalf = size / 2.0;
- if (renderInfo.isHitTestRender) {
- ctx.fillRect(x - widthHalf, y - heightHalf, size, size);
- } else {
- // color markers based on population of cities
- var pop = renderInfo.data.item()["Population"];
- if (pop > 0)
- ctx.fillStyle = "rgba(120,120,120,0.8)";
- if (pop > 100000)
- ctx.fillStyle = "rgba(160,200,20,0.8)";
- if (pop > 1000000)
- ctx.fillStyle = "rgba(210,155,20,0.8)";
- if (pop > 5000000)
- ctx.fillStyle = "rgba(210,60,20,0.8)";
- if (pop > 10000000)
- ctx.fillStyle = "rgba(155,20,20,0.8)";
- size = 3;
- ctx.globalAlpha = 1;
- ctx.strokeStyle = "rgba(20,20,20,0.36)";
- ctx.beginPath();
- ctx.arc(x, y, size, 0, 2.0 * Math.PI);
- ctx.fill();
- ctx.stroke();
- }
- }
- }
- }]
- });
- $("#map").find(".ui-widget-content").append("<span class='copyright-notice'><a href='https://www.openstreetmap.org/copyright'>© OpenStreetMap contributors</a></span>");
- };
- });
- </script>
- <div>
- <div id="map"></div>
- </div>
Listing 16.
Also, add the ActionLink on the Index.cshtml page to access the Symbol Series view.
- @{
- ViewData["Title"] = "Index";
- }
- <h2>Types of Maps</h2>
- <ul>
- <li>
- <a href="@Url.Action("SymbolSeries", "Home")">
- Symbol Series
- </a>
- </li>
- </ul>
Listing 17.
Now, run the application in the web browser and open the page.
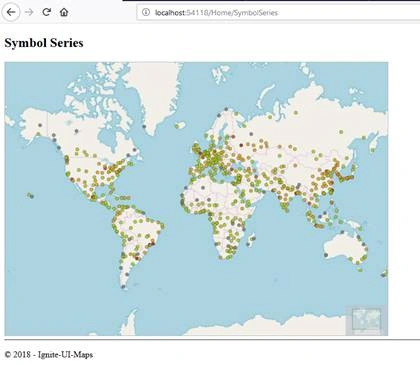
Figure 13.
Proportional Symbol Series
Add the action method in side the HomeController for ProportionalSymbolSeries map and add the following code,
- public IActionResult ProportionalSymbolSeries()
- {
- return View();
- }
Listing 18.
Now right click on the ProprotionalSymbolSeries action method and click "Add View" to add a view for this action method. A view for ProprotionalSymbolSeries will get added at the following location in the project “\Views\Home\ProprotionalSymbolSeries.cshtml”.
Add the following HTML and script inside the “ProprotionalSymbolSeries.cshtml” for the rendering the Proportional Symbol Series map type.
- @{
- ViewData["Title"] = "ProportionalSymbolSeries";
- }
- <script id="geoSymbolTooltip" type="text/x-jquery-tmpl">
- <table id="tooltipTable">
- <tr><th colspan="2">${item.City}, ${item.Country}</th></tr>
- <tr>
- <td>Population:</td>
- <td>${item.Population}</td>
- </tr>
- </table>
- </script>
- <h2>Proportional Symbol Series</h2>
- <script type="text/javascript">
- $(function () {
- function CreateEarthquakes(count) {
- count = count || 50;
- var data = [];
- for (i = 0; i < count; i++)
- {
- var x = Math.floor((Math.random() * 360) - 180);
- var y = Math.floor((Math.random() * 180) - 90);
- var m = Math.floor((Math.random() * 10) + 1);
- var point = { "Magnitude": m, "Longitude": x, "Latitude": y };
- data.push(point);
- }
- return data;
- }
- var data = CreateEarthquakes(100);
- function createMap() {
- $("#map").igMap({
- width: "700px",
- height: "500px",
- series: [{
- name: "series1",
- type: "geographicProportionalSymbol",
- dataSource: data,
- markerType: "circle",
- markerOutline: "black",
- longitudeMemberPath: "Longitude",
- latitudeMemberPath: "Latitude",
- radiusMemberPath: "Magnitude",
- radiusScale: {
- minimumValue: 10,
- maximumValue: 40,
- },
- fillMemberPath: "Magnitude",
- fillScale: {
- type: "value",
- brushes: ["red", "yellow"],
- minimumValue: 1,
- maximumValue: 12,
- }
- },
- ]
- });
- };
- createMap();
- });
- </script>
- <div>
- <div id="map"></div>
- </div>
Listing 19.
Also, add the ActionLink on the Index.cshtml page to access the Symbol Series view.
- @{
- ViewData["Title"] = "Index";
- }
- <h2>Types of Maps</h2>
- <ul>
- <li>
- <a href="@Url.Action("ProportionalSymbolSeries", "Home")">
- Proportional Symbol Series
- </a>
- </li>
- </ul>
Listing 20.
Now, run the application in a web browser and open the page.
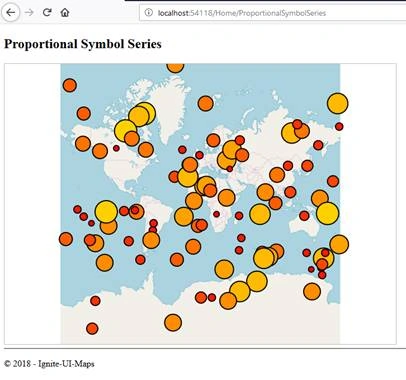
Figure 14.
Shapes Series
Add the action method inside the HomeController for ShapesSeries Map and add the following code.
- public IActionResult ShapesSeries()
- {
- return View();
- }
Listing 21.
Now right click on the ShapesSeries action method and click add View to add a view for this action method. A View for ProprotionalSymbolSeries will get added at the following location in the project “\Views\Home\ShapesSeries.cshtml”.
Add the following HTML and script inside the “ShapesSeries.cshtml” for the rendering the Shapes Series map type.
- @{
- ViewData["Title"] = "ShapesSeries";
- }
- <h2>Shapes Series</h2>
- <style>
- #tooltipTable {
- font-family: Verdana, Arial, Helvetica, sans-serif;
- width: 100%;
- border-collapse: collapse;
- }
- #tooltipTable td, #tooltipTable th {
- font-size: 9px;
- border: 1px solid #2d87cb;
- padding: 3px 7px 2px 7px;
- }
- #tooltipTable th {
- font-weight: bold;
- font-size: 11px;
- text-align: left;
- padding-top: 5px;
- padding-bottom: 4px;
- background-color: #2d87cb;
- color: #ffffff;
- }
- </style>
- <script id="geoShapeTooltip" type="text/x-jquery-tmpl">
- <table id="tooltipTable">
- <tr>
- <th class="tooltipHeading" colspan="2">
- ${item.fieldValues.NAME}, ${item.fieldValues.REGION}
- </th>
- </tr>
- <tr>
- <td>Population:</td>
- <td>${item.fieldValues.POP2005}</td>
- </tr>
- </table>
- </script>
- <script type="text/javascript" src="https://www.igniteui.com/js/map-helper.js"></script>
- <script type="text/javascript">
- function ColorPickerByIndex(min, max) {
- // Initialize internal state
- var brushes = ["#d9c616", "#d96f17", "#d1150c"];
- var interval = (max - min) / (brushes.length - 1);
- // Returns a color from the brushes array depending on the input value
- this.getColorByIndex = function(val) {
- var index = Math.round(val / interval);
- if (index < 0) {
- index = 0;
- } else if (index > (brushes.length - 1)) {
- index = brushes.length - 1;
- }
- return brushes[index];
- };
- }
- $(function () {
- var colorPicker = new ColorPickerByIndex(100000, 500000000);
- // alternative functions for generating color based on a data value
- var getColorValue = function (val) {
- var ratio = val / 1338299500.0;
- var col = 255.0 * ratio;
- var colString = "rgba(0,50," + Math.round(col) + ",0.45)";
- return colString;
- };
- var getLogColorValue = function (val) {
- var ratio = Math.log(val) / Math.log(1338299500.0);
- var col = 255.0 * ratio;
- var colString = "rgba(0,50," + Math.round(col) + ",0.45)";
- return colString;
- };
- $("#map").igMap({
- width: "700px",
- height: "500px",
- windowRect: { left: 0.1, top: 0.1, height: 0.7, width: 0.7 },
- overviewPlusDetailPaneVisibility: "visible",
- overviewPlusDetailPaneBackgroundImageUri: "https://www.igniteui.com/images/samples/maps/world.png",
- series: [{
- type: "geographicShape",
- name: "worldCountries",
- markerType: "none",
- shapeMemberPath: "points",
- shapeDataSource: 'https://www.igniteui.com/data-files/shapes/world_countries_reg.shp',
- databaseSource: 'https://www.igniteui.com/data-files/shapes/world_countries_reg.dbf',
- opacity: 0.8,
- outlineThickness: 1,
- showTooltip: true,
- tooltipTemplate: "geoShapeTooltip",
- shapeStyleSelector: {
- selectStyle: function (s, o) {
- var pop = s.fields.item("POP2005");
- var popInt = parseInt(pop);
- var colString = colorPicker.getColorByIndex(popInt); / /getColorValue(popInt);
- return {
- fill: colString,
- stroke: "gray"
- };
- }
- }
- }]
- });
- $("#map").find(".ui-widget-content").append("<span class='copyright-notice'><a href='https://www.openstreetmap.org/copyright'>© OpenStreetMap contributors</a></span>");
- });
- </script>
- <div id="map"></div>
Listing 22.
Also, add the ActionLink on the Index.cshtml page to access the Symbol Series view.
- @{
- ViewData["Title"] = "Index";
- }
- <h2>Types of Maps</h2>
- <ul>
- <li>
- <a href="@Url.Action("ShapesSeries", "Home")">
- Shapes Series
- </a>
- </li>
- </ul>
Listing 23.
Now, run the application in the web browser and open the page.
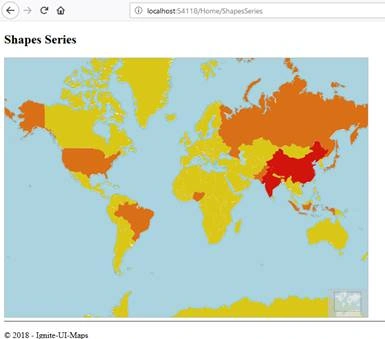
Figure 15.
Area Series
Add the action method inside the HomeController for AreaSeries map and add the following code.
- public IActionResult AreaSeries()
- {
- return View();
- }
Listing 21.
Now right click on the AreaSeries action method and click add View to add a view for this action method. A View for AreaSeries will get added at the following location in the project “\Views\Home\AreaSeries.cshtml”.
Add the following HTML and script inside the “AreaSeries.cshtml” for the rendering the Area Series map type.
- @{
- ViewData["Title"] = "Area Series";
- }
- <h2>Area Series</h2>
- <script type="text/javascript">
- $(function () {
- $("#map").igMap({
- width: "700px",
- height: "500px",
- overviewPlusDetailPaneVisibility: "visible",
- overviewPlusDetailPaneBackgroundImageUri: "https://www.igniteui.com/images/samples/maps/world.png",
- series: [{
- type: "geographicScatterArea",
- name: "precipitation",
- colorScale: {
- type: "customPalette",
- interpolationMode: "interpolateRGB",
- minimumValue: 0.15,
- palette: [
- "#3300CC", "#4775FF", "#0099CC", "#00CC99",
- "#33CC00", "#99CC00", "#CC9900", "#FFC20A", "#CC3300"]
- },
- triangleVertexMemberPath1: "v1",
- triangleVertexMemberPath2: "v2",
- triangleVertexMemberPath3: "v3",
- longitudeMemberPath: "pointX",
- latitudeMemberPath: "pointY",
- colorMemberPath: "value",
- triangulationDataSource: "https://www.igniteui.com/data-files/shapes/nws_precip_2011091820.itf",
- }],
- windowRect: {
- left: 0.31,
- top: 0.375,
- height: 0.025,
- width: 0.025
- }
- });
- $("#map").find(".ui-widget-content").append("<span class='copyright-notice'><a href='https://www.openstreetmap.org/copyright'>© OpenStreetMap contributors</a></span>");
- });
- </script>
- <div id="map"></div>
Listing 22.
Also, add the ActionLink on the Index.cshtml page to access the Symbol Series view.
- @{
- ViewData["Title"] = "Index";
- }
- <h2>Types of Maps</h2>
- <ul>
- <li>
- <a href="@Url.Action("AreaSeries", "Home")">
- Area Series
- </a>
- </li>
- </ul>
Listing 23.
Now, run the application in a web browser and open the page.
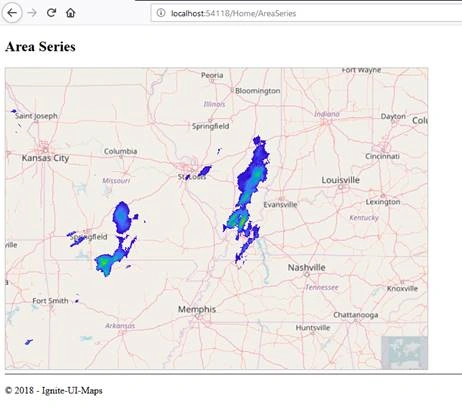
Figure 16.
Contour Series
Add the action method inside the HomeController for ContourSeries map and add the following code.
- public IActionResult ContourSeries()
- {
- return View();
- }
Listing 21.
Now, right click on the ContourSeries action method and click add View to add a view for this action method. A view for ContourSeries will get added at the following location in the project “\Views\Home\ContourSeries.cshtml”.
Add the following HTML and script inside the “ContourSeries.cshtml” for rendering the Contour Series map type.
- @{
- ViewData["Title"] = "Contour Series";
- }
- <h2>Contour Series</h2>
- <script type="text/javascript">
- $(function () {
- $("#map").igMap({
- width: "700px",
- height: "500px",
- overviewPlusDetailPaneVisibility: "visible",
- overviewPlusDetailPaneBackgroundImageUri: "https://www.igniteui.com/images/samples/maps/world.png",
- series: [{
- type: "geographicContourLine",
- name: "precipitation",
- fillScale: {
- type: "value",
- brushes: [
- "#3300CC", "#4775FF", "#0099CC", "#00CC99",
- "#33CC00", "#99CC00", "#CC9900", "#FFC20A", "#CC3300"]
- },
- triangleVertexMemberPath1: "v1",
- triangleVertexMemberPath2: "v2",
- triangleVertexMemberPath3: "v3",
- longitudeMemberPath: "pointX",
- latitudeMemberPath: "pointY",
- valueMemberPath: "value",
- triangulationDataSource: "https://www.igniteui.com/data-files/shapes/nws_precip_2011091820.itf",
- }],
- windowRect: {
- left: 0.31,
- top: 0.375,
- height: 0.025,
- width: 0.025
- }
- });
- $("#map").find(".ui-widget-content").append("<span class='copyright-notice'><a href='https://www.openstreetmap.org/copyright'>© OpenStreetMap contributors</a></span>");
- });
- </script>
- <div id="map"></div>
Listing 22.
Also, add the ActionLink on the Index.cshtml page to access the Countor Series view.
- @{
- ViewData["Title"] = "Index";
- }
- <h2>Types of Maps</h2>
- <ul>
- <li>
- <a href="@Url.Action("AreaSeries", "Home")">
- Area Series
- </a>
- </li>
- </ul>
Listing 23.
Now run the application in web browser and open the page.
Marker Template
Add the action method in side the Home Controller for MarkerTemplate map and add the following code.
- public IActionResult MarkerTemplate()
- {
- return View();
- }
Listing 24.
Now right click on the MarkerTemplate action method and click add View to add a view for this action method. A View for MarkerTemplate will get added at the following location in the project “\Views\Home\MarkerTemplate.cshtml”
Add the following html and script in side the “MarkerTemplate.cshtml” for the rendering the market template map type.
- @{
- ViewData["Title"] = "Marker Template";
- }
- <style>
- #customTable2 {
- font-family: Verdana, Arial, Helvetica, sans-serif;
- width: 100%;
- border-collapse: collapse;
- }
- #customTable2 td, #customTable2 th {
- font-size: 9px;
- border: 1px solid #2d87cb;
- padding: 3px 7px 2px 7px;
- }
- #customTable2 th {
- font-weight: bold;
- font-size: 11px;
- text-align: left;
- padding-top: 5px;
- padding-bottom: 4px;
- background-color: #2d87cb;
- color: #ffffff;
- }
- </style>
- <script id="customTooltip" type="text/x-jquery-tmpl">
- <table id="customTable2">
- <tr><th colspan="2">${item.Name}</th></tr>
- <tr>
- <td>Office Type:</td>
- <td>${item.Type}</td>
- </tr>
- </table>
- </script>
- <h2>Marker Template</h2>
- <script src="https://www.igniteui.com/data-files/ig-offices.js"></script>
- <script type="text/javascript">
- $(function () {
- $("#map").igMap({
- width: "700px",
- height: "500px",
- overviewPlusDetailPaneVisibility: "visible",
- overviewPlusDetailPaneBackgroundImageUri: "https://www.igniteui.com/images/samples/maps/world.png",
- windowRect: { left: 0.4, top: 0.2, height: 0.6, width: 0.6 },
- backgroundContent: {
- type: "openStreet"
- },
- series: [
- {
- type: "geographicSymbol",
- name: "igOffices",
- dataSource: igOffices,
- latitudeMemberPath: "Latitude",
- longitudeMemberPath: "Longitude",
- showTooltip: true,
- tooltipTemplate: "customTooltip",
- markerCollisionAvoidance: "fade",
- // Defines marker template rendering function
- markerTemplate: {
- measure: function (measureInfo) {
- measureInfo.width = 10;
- measureInfo.height = 10;
- },
- render: function (renderInfo) {
- createMarker(renderInfo);
- }
- }
- }
- ]
- });
- $("#map").find(".ui-widget-content").append("<span class='copyright-notice'><a href='https://www.openstreetmap.org/copyright'>© OpenStreetMap contributors</a></span>");
- });
- function createMarker(renderInfo) {
- var ctx = renderInfo.context;
- var x = renderInfo.xPosition;
- var y = renderInfo.yPosition;
- var size = 10;
- var heightHalf = size / 2.0;
- var widthHalf = size / 2.0;
- if (renderInfo.isHitTestRender) {
- // This is called for tooltip hit test only
- // Rough marker rectangle size calculation
- ctx.fillStyle = renderInfo.data.actualItemBrush().fill();
- ctx.fillRect(x - widthHalf, y - heightHalf, size, size);
- }
- else
- {
- var data = renderInfo.data;
- var name = data.item()["Name"];
- var type = data.item()["ID"];
- // Draw text
- ctx.textBaseline = "top";
- ctx.font = '8pt Verdana';
- ctx.fillStyle = "black";
- ctx.textBaseline = "middle";
- wrapText(ctx, name, x + 3, y + 6, 80, 12);
- // Draw marker
- ctx.beginPath();
- ctx.arc(x, y, 4, 0, 2 * Math.PI, false);
- if (type == "Marketing")
- ctx.fillStyle = "#2372D1";
- else if (type == "Support")
- ctx.fillStyle = "#4d4949";
- else if (type == "Development Lab")
- ctx.fillStyle = "#d13521";
- else
- ctx.fillStyle = "#36a815";
- ctx.fill();
- ctx.lineWidth = 1;
- ctx.strokeStyle = "black";
- ctx.stroke();
- }
- }
- // Plots a rectangle with rounded corners with a semi-transparent frame
- function plotTextBackground(context, left, top, width, height) {
- var cornerRadius = 3;
- context.beginPath();
- // Upper side and upper right corner
- context.moveTo(left + cornerRadius, top);
- context.lineTo(left + width - cornerRadius, top);
- context.arcTo(left + width, top, left + width, top + cornerRadius, cornerRadius);
- // Right side and lower right corner
- context.lineTo(left + width, top + height - cornerRadius);
- context.arcTo(left + width, top + height, left + width - cornerRadius, top + height, cornerRadius);
- // Lower side and lower left corner
- context.lineTo(left + cornerRadius, top + height);
- context.arcTo(left, top + height, left, top + height - cornerRadius, cornerRadius);
- // Left side and upper left corner
- context.lineTo(left, top + cornerRadius);
- context.arcTo(left, top, left + cornerRadius, top, cornerRadius);
- // Fill white with 75% opacity
- context.globalAlpha = 1;
- context.fillStyle = "white";
- context.fill();
- context.globalAlpha = 1;
- // Plot grey frame
- context.lineWidth = 1;
- context.strokeStyle = "grey";
- context.stroke();
- }
- // Outputs text in a word wrapped fashion in a transparent frame
- function wrapText(context, text, x, y, maxWidth, lineHeight) {
- var words = text.split(" ");
- var line = "";
- var yCurrent = y;
- var lines = [], currentLine = 0;
- // Find the longest word in the text and update the max width if the longest word cannot fit
- for (var i = 0; n < words.length; i++) {
- var testWidth = context.measureText(words[i]);
- if (testWidth > maxWidth)
- maxWidth = metrics.width;
- }
- // Arrange all words into lines
- for (var n = 0; n < words.length; n++) {
- var testLine = line + words[n];
- var testWidth = context.measureText(testLine).width;
- if (testWidth > maxWidth) {
- lines[currentLine] = line;
- currentLine++;
- line = words[n] + " ";
- }
- else {
- line = testLine + " ";
- }
- }
- lines[currentLine] = line;
- // Plot frame and background
- if (lines.length > 1) {
- // Multiline text
- plotTextBackground(context, x - 2, y - lineHeight / 2 - 2, maxWidth + 3, lines.length * lineHeight + 3);
- }
- else {
- // Single line text
- var textWidth = context.measureText(lines[0]).width; // Limit frame width to the actual line width
- plotTextBackground(context, x - 2, y - lineHeight / 2 - 2, textWidth + 3, lines.length * lineHeight + 3);
- }
- // Output lines of text
- context.fillStyle = "black";
- for (var n = 0; n < lines.length; n++) {
- context.fillText(" " + lines[n], x, yCurrent);
- yCurrent += lineHeight;
- }
- }
- </script>
- <div>
- <div id="map"></div>
- </div>
Listing 25.
Also add the ActionLink on the Index.cshtml page to access the Contor Series view.
- @{
- ViewData["Title"] = "Index";
- }
- <h2>Types of Maps</h2>
- <ul>
- <li>
- <a href="@Url.Action("MarketTemplate", "Home")">
- Market Template
- </a>
- </li>
- </ul>
Listing 26.
Now run the application in web browser and open the page.
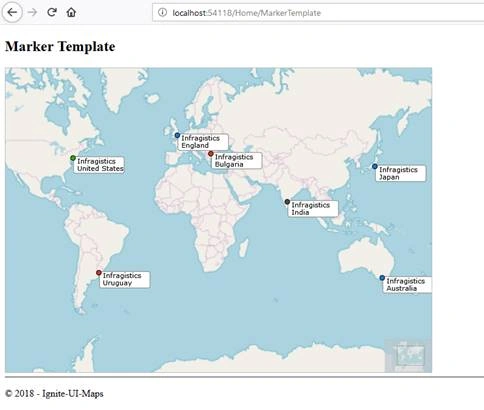
Figure 17.
Polyline Series
Add the action method in side the HomeController for PolylineSeries Map and add the following code.
- public IActionResult PolylineSeries()
- {
- return View();
- }
Listing 24.
Now right click on the PolylineSeries action method and click add view to add a view for this action method. A View for PolylineSeries will get added at the following location in the project “\Views\Home\PolylineSeries.cshtml”
Add the following html and script in side the “PolylineSeries.cshtml” for the rendering the market template map type.
- @{
- ViewData["Title"] = "Polyline Series";
- }
- <script src="https://www.igniteui.com/js/map-helper.js" type="text/javascript"></script>
- <style>
- #tooltipTable {
- font-family: Verdana, Arial, Helvetica, sans-serif;
- width: 100%;
- border-collapse: collapse;
- }
- #tooltipTable td, #tooltipTable th {
- font-size: 9px;
- border: 1px solid #5da7df;
- padding: 3px 7px 2px 7px;
- }
- #tooltipTable th {
- font-weight: bold;
- font-size: 11px;
- text-align: left;
- padding-top: 5px;
- padding-bottom: 4px;
- background-color: #5da7df;
- color: #ffffff;
- }
- </style>
- <script id="geoSymbolTooltip" type="text/x-jquery-tmpl">
- <table id="tooltipTable">
- <tr><th colspan="2">${item.City}, ${item.Country}</th></tr>
- <tr>
- <td>Population:</td>
- <td>${item.Population}</td>
- </tr>
- </table>
- </script>
- <h2>Polyline Series</h2>
- <script type="text/javascript">
- $(function () {
- // load geo-locations from shapefile and simplify data structure
- var worldAirports = [];
- var worldConnections = [];
- var worldCities = [];
- var points = [];
- var shapeDataSource = new $.ig.ShapeDataSource({
- shapefileSource: "https://www.igniteui.com/data-files/shapes/world_cities.shp",
- databaseSource: "https://www.igniteui.com/data-files/shapes/world_cities.dbf",
- transformRecord: function (rec) {
- var pointX = rec.points.item(0).item(0).x();
- var pointY = rec.points.item(0).item(0).y();
- var city = rec.fields.item("NAME");
- var country = rec.fields.item("COUNTRY");
- var population = rec.fields.item("POPULATION");
- if (population > 0) {
- points.push({
- Latitude: pointY, Longitude: pointX,
- City: city, Country: country,
- Population: population
- });
- }
- },
- // process data and create map when finished loading shapefile
- callback: function () {
- worldCities = points;
- generateConnections();
- createMap();
- }
- });
- shapeDataSource.dataBind();
- // generate flight paths and airport connections
- function generateConnections() {
- var count = worldCities.length;
- var airports = [];
- var flights = [];
- var minDistance = 200;
- var maxDistance = 7000;
- var maxConnections = 300;
- var total = 0;
- for (var i = 0; i < count; i++) {
- var connections = [];
- var origin = worldCities[i];
- for (var ii = 0; ii < count; ii++) {
- var dest = worldCities[ii];
- if (origin.City != dest.City &&
- origin.Population > dest.Population &&
- origin.Country == "US" &&
- dest.Country == "US") {
- var hasConnection = false;
- var distance = calcGeoDistance(origin, dest);
- if (distance > minDistance &&
- distance < maxDistance) {
- if (origin.Population > 3000000 &&
- dest.Population > 500000 && distance < maxDistance) {
- hasConnection = true;
- }
- // optional code to add more connections
- //if (origin.Population > 1000000 &&
- // dest.Population > 250000 && distance < maxDistance * 0.75) {
- // hasConnection = true;
- //}
- //if (origin.Population > 500000 &&
- // dest.Population > 100000 && distance < maxDistance * 0.5) {
- // hasConnection = true;
- //}
- }
- if (hasConnection) {
- var path = [];
- path = calcGeoPath(origin, dest);
- connections.push(path);
- airports.push(dest);
- total++;
- }
- }
- }
- if (connections.length > 0) {
- flights.push({ city: origin, points: connections });
- airports.push(origin);
- }
- if (total > maxConnections) break;
- }
- worldConnections = flights;
- worldAirports = airports;
- }
- // calculate geo-path between two locations
- function calcGeoPath(origin, dest) {
- var interval = 200;
- var path = [];
- var distance = calcGeoDistance(origin, dest);
- if (distance <= interval) {
- path.push({ x: origin.Longitude, y: origin.Latitude });
- path.push({ x: dest.Longitude, y: dest.Latitude });
- } else {
- var current = origin;
- for (var dist = interval; dist <= distance; dist += interval) {
- path.push({ x: current.Longitude, y: current.Latitude });
- var bearing = calcBearing(current, dest);
- current = calcDestination(current, bearing, interval);
- }
- path.push({ x: dest.Longitude, y: dest.Latitude });
- }
- return path;
- }
- // calculate bearing angle between two locations
- function calcBearing(origin, dest) {
- origin = toRadianLocation(origin);
- dest = toRadianLocation(dest);
- //var dLat = (dest.Latitude - origin.Latitude);
- var dLon = (dest.Longitude - origin.Longitude);
- var y = Math.sin(dLon) * Math.cos(dest.Latitude);
- var x = Math.cos(origin.Latitude) * Math.sin(dest.Latitude) -
- Math.sin(origin.Latitude) * Math.cos(dest.Latitude) * Math.cos(dLon);
- var angle = Math.atan2(y, x);
- return toDegreesNormalized(angle);
- }
- // calculate destination for origin location and travel distance
- function calcDestination(origin, bearing, distance) {
- var radius = 6371.0;
- origin = toRadianLocation(origin);
- bearing = toRadians(bearing);
- distance = distance / radius; // angular distance in radians
- var latitude = Math.asin(Math.sin(origin.Latitude) * Math.cos(distance) +
- Math.cos(origin.Latitude) * Math.sin(distance) * Math.cos(bearing));
- var x = Math.sin(bearing) * Math.sin(distance) * Math.cos(origin.Latitude);
- var y = Math.cos(distance) - Math.sin(origin.Latitude) * Math.sin(origin.Latitude);
- var longitude = origin.Longitude + Math.atan2(x, y);
- longitude = (longitude + 3 * Math.PI) % (2 * Math.PI) - Math.PI; // normalize to -180..+180º
- longitude = toDegrees(longitude);
- latitude = toDegrees(latitude);
- return { Longitude: longitude, Latitude: latitude };
- }
- // calculate distance between two locations
- function calcGeoDistance(origin, dest) {
- origin = toRadianLocation(origin);
- dest = toRadianLocation(dest);
- var sinProd = Math.sin(origin.Latitude) * Math.sin(dest.Latitude);
- var cosProd = Math.cos(origin.Latitude) * Math.cos(dest.Latitude);
- var dLon = (dest.Longitude - origin.Longitude);
- var angle = Math.acos(sinProd + cosProd * Math.cos(dLon));
- var distance = angle * 6371.0;
- return distance; // * 6371.0; // in km
- }
- function toRadianLocation(geoPoint) {
- var longitude = toRadians(geoPoint.Longitude);
- var latitude = toRadians(geoPoint.Latitude);
- return { Longitude: longitude, Latitude: latitude };
- }
- function toRadians(degrees) {
- return degrees * Math.PI / 180;
- }
- function toDegrees(radians) {
- return (radians * 180.0 / Math.PI);
- }
- function toDegreesNormalized(radians) {
- var degrees = toDegrees(radians);
- degrees = (degrees + 360) % 360;
- return degrees;
- }
- function createMap() {
- $("#map").igMap({
- width: "700px",
- height: "500px",
- overviewPlusDetailPaneVisibility: "visible",
- overviewPlusDetailPaneBackgroundImageUri: "https://www.igniteui.com/images/samples/maps/world.png",
- windowRect: {
- left: 0.180,
- top: 0.3143,
- width: 0.180,
- height: 0.180
- },
- series: [{
- type: "geographicPolyline",
- name: "worldConnections",
- shapeMemberPath: "points",
- dataSource: worldConnections,
- shapeFilterResolution: 5.0,
- outline: "rgba(20,20,20,0.5)",
- thickness: 0.75,
- showTooltip: false,
- },
- {
- type: "geographicSymbol",
- name: "worldAirports",
- dataSource: worldAirports,
- longitudeMemberPath: "Longitude",
- latitudeMemberPath: "Latitude",
- markerType: "circle",
- markerCollisionAvoidance: "fade",
- markerOutline: "rgba(90,160,220,0.9)",
- markerBrush: "rgba(90,160,220,0.7)",
- showTooltip: true,
- tooltipTemplate: "geoSymbolTooltip",
- }
- ]
- });
- $("#map").find(".ui-widget-content").append("<span class='copyright-notice'><a href='https://www.openstreetmap.org/copyright'>© OpenStreetMap contributors</a></span>");
- };
- });
- </script>
- <div>
- <div id="map"></div>
- </div>
Listing 25.
Also add the ActionLink on the Index.cshtml page to access the Contor Series view.
- @{
- ViewData["Title"] = "Index";
- }
- <h2>Types of Maps</h2>
- <ul>
- <li>
- <a href="@Url.Action("Polyline", "Home")">
- Polyline Series
- </a>
- </li>
- </ul>
Listing 26.
Now run the application in web browser and open the page.
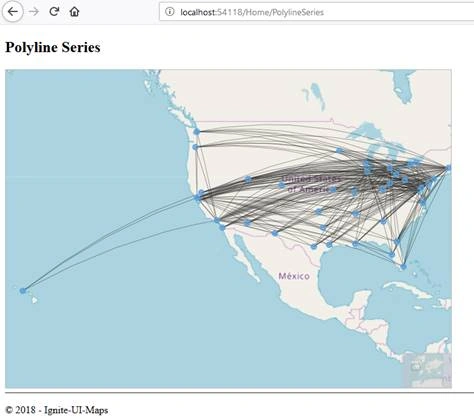
Figure 17.
Summary
Using map in web application is very useful it can be use as a an actual map for representing the geographic locations. There are other use of map in web applications like Checking for certain spots like restaurants, cafe. Other use is monitoring the traffics, In e-commerce applications providing the location based discounts to increase sale. Tracking the physical activities like running, walk etc. Calculating cost of shipping charge. There are many ways to use the maps that will certainly add the benefits to business.
Learn more, download a free trial, and get started here,
- Get Started with Ignite UI for JavaScript.
- Download the code here.
MM JAckPosted Jul 17, 2024, 9:55 AM
Nyce Article