


Following up on my last post about the Cardinality Estimator, let’s talk about column statistics and how they work and play a part in execution plans. The cardinality estimator relies heavily on statistics to get the answer to selectivity (the ratio of distinct values to the total number of values) questions and calculate a cost estimate. This hopefully gives us the best possible execution plans for queries. In this post, I will show you where to find information about what your statistics contain and information regarding each of those fields. Then we will look at the impact of over and underestimations caused by stale or missing statistics (or even data skew). Finally, you will learn the best approaches to statistics maintenance.
Breaking Down the Stats
Statistics are made up of three parts. Each part tells the optimizer important information regarding the making of the table’s data distribution.
- Header – Last Time Stats were updated and number of sample rows
- Density Vector – Uniqueness of the columns or set of columns
- Histogram- Data’s distribution and frequency of distinct values
Let’s look at a Header, Density and Histogram example.
You can read what the statistic is broken down into using DBCC SHOW_STATISTICS. All field definitions are taken from MSDN.
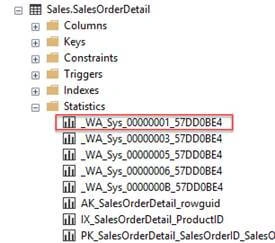
This is from AdventureWorks2016CTP3 sample database if you want to follow along. Using the Sales. SalesOrderDetail table let’s look the stats and see what we can find out what it shows us.
Example Statistic
STAT_HEADER
DBCC SHOW_STATISTICS ('[Sales].[SalesOrderDetail]',[_WA_Sys_00000001_57DD0BE4]) WITH STAT_HEADER;
ENGLISH
This table has keys averaging 4 bytes and 3.366 distinct key values out of 121,317 total rows. Now looking at the row you'll note you don't see 3.366 anywhere. That's because I calculated it as 1/.2727844 which was the Density value in the row. As you can see this stat has not been updated since 2015.

- Steps Number of steps in the histogram. Each step spans a range of column values followed by an upper bound column value. The histogram steps are defined on the first key column in the statistics. The maximum number of steps is 200.
- Density Calculated as 1 / distinct values for all values in the first key column of the statistics object, excluding the histogram boundary values. This Density value is not used by the query optimizer and is displayed for backward compatibility with versions before SQL Server 2008.
- Average Key Length Average number of bytes per value for all of the key columns in the statistics object.
- String Index Yes indicates the statistics object contains string summary statistics to improve the cardinality estimates for query predicates that use the LIKE operator; for example, WHERE ProductName LIKE '%Bike'. String summary statistics are stored separately from the histogram and are created on the first key column of the statistics object when it is of type char, varchar, nchar, nvarchar, varchar(max), nvarchar(max), text, or ntext..
- Filter Expression Predicate for the subset of table rows included in the statistics object. NULL = non-filtered statistics. For more information about filtered predicates, see Create Filtered Indexes. For more information about filtered statistics, see Statistics.
- Unfiltered RowsTotal number of rows in the table before applying the filter expression. If Filter Expression is NULL, Unfiltered Rows is equal to Rows.
DENSITY_VECTOR
DBCC SHOW_STATISTICS ('[Sales].[SalesOrderDetail]',[_WA_Sys_00000001_57DD0BE4]) WITH DENSITY_VECTOR;
ENGLISH
The SalesOrderID column can have 29,753 distinct combinations. How did I get that number? You take 1 divided by the all All Density number in this case .0000336114. Higher the density lowers the selectivity.

- All Density Density is 1 / distinct values. Results display density for each prefix of columns in the statistics object, one row per density. A distinct value is a distinct list of the column values per row and per columns prefix. For example, if the statistics object contains key columns (A, B, C), the results report the density of the distinct lists of values in each of these column prefixes: (A), (A, B), and (A, B, C). Using the prefix (A, B, C), each of these lists is a distinct value list: (3, 5, 6), (4, 4, 6), (4, 5, 6), (4, 5, 7). Using the prefix (A, B) the same column values have these distinct value lists: (3, 5), (4, 4), and (4, 5)
- Average Length in bytes, to store a list of the column values for the column prefix. For example, if the values in the list (3, 5, 6) each require 4 bytes the length is 12 bytes.
- Columns Names of columns in the prefix for which All density and Average length are displayed.
HISTOGRAM
DBCC SHOW_STATISTICS ('[Sales].[SalesOrderDetail]',[_WA_Sys_00000001_57DD0BE4]) WITH HISTOGRAM;
ENGLISH
The histogram is showing us the frequency of occurrence for each distinct value in a data set. Let’s look at the first two rows. Our starting value is 43639 if we step from that value to the next HI_KEY 43692 we see that the distribution of that data says there are 32 distinct combinations between row 1 and row 2 and 311 rows in between them. EQ Rows tells us that at the 2 step (row 2) there are 28 values that equal the row value (43692). I find the Histogram very confusing so if you not following it’s ok. 😊 Read again and think of step ladder. The space in between each wrung is data.
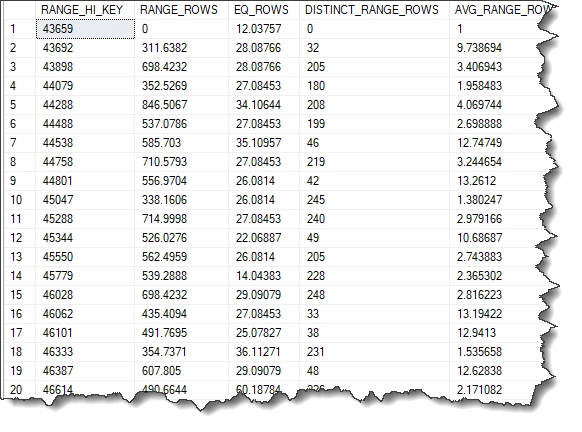
- RANGE_HI_KEY Upper bound column value for a histogram step. The column value is also called a key value.
- RANGE_ROWS Estimated number of rows whose column value falls within a histogram step, excluding the upper bound.
- EQ_ROWS Estimated number of rows whose column value equals the upper bound of the histogram step.
- DISTINCT_RANGE_ROWS Estimated number of rows with a distinct column value within a histogram step, excluding the upper bound.
- AVG_RANGE_ROWS Average number of rows with duplicate column values within a histogram step, excluding the upper bound (RANGE_ROWS / DISTINCT_RANGE_ROWS for DISTINCT_RANGE_ROWS > 0).
Now, let's take a look at how you can keep these numbers as accurate as possible.
Statistics Maintenance
It is very import to keep statistics up to date to ensure the Actual rows and Estimated rows are as aligned as closely as possible. For each insert, update, and delete change the data the distribution changes and can skew your estimations. These skews can lead to less than optimal query plans and performance degradation. Setting up a weekly update statistics job can help keep them up to date. (Note: some systems may require far more frequent updates--I’ve had to update stats every 10 minutes on a particularly troublesome table). Also, make sure you have AUTO_UPDATE_STATISTICS set. However, note this option will only update statistics created for indexes or single-columns in query predicates. Luckily, it also updates those you have manually created with the CREATE STATISTICS statement.
AUTO_UPDATE_STATISTICS triggers a statistics update based on a threshold of 20% row change. Now as you can imagine for large tables achieving the percent change needed to trigger an update can take a long time and often results in stale statistics on larger tables. To solve this issue, you can use Trace Flag 2371 to the lower the threshold that will trigger an update of the statistics on a sliding scale. Recognizing that this can be a real issue, this is now set as a default in 2016 or later.
Estimation Skews
In looking for skews pay attention to the difference between ACTUAL and ESTIMATED

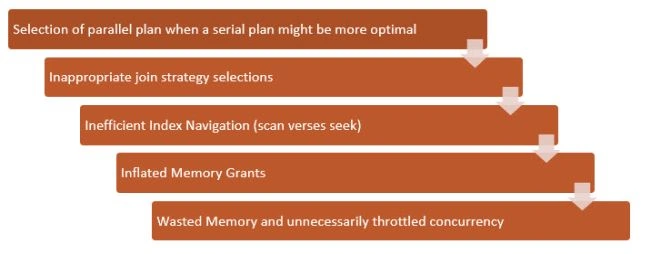
Underestimations can lead to …

Adversely, overestimations will lead to….
For the query optimizer to generate the best plan possible statistics need to be cared for and carefully maintained. You also need an understanding of what they are and how they are used. If you are using SQL Server 2017 in conjunction with column store indexes, there are some improvements for this, for the rest of you, you should ensure your stats are up to date.
Arvind SinghPosted May 31, 2018, 5:11 AM
Very good information on statistics, thanks for sharing..