

Line Chart in WPF
The WPF Toolkit released in June 2009 comes with a data visualization assembly called "System.Windows.Controls.DataVisualization.Toolkit.dll" that hosts the charting functionality in WPF. This article demonstrates how to draw line charts using the WPF Toolkit.
Note
This article is written using the WPF Toolkit June 2009 that you can download from here: WPF Toolkit - Release: WPF Toolkit June 2009. This toolkit may be a part of WPF in near future versions.
Adding WPF Toolkit Reference
Before you can use any charting related functionality in a WPF application, you must download the WPF Toolkit. After that you need to add a reference to an assembly.
To add a reference, right-click the References folder of your project in Solution Explorer and select "Add Reference". This action will open the Add Reference dialog as you can see in the following Figure 1. On this dialog, select "Browse" and browse to the "System.Windows.Controls.DataVisualization.Toolkit.dll" assembly from the folder where you installed the WPF Toolkit. This assembly resides in the Binaries folder.
Tip
If you do not want to download the WPF Toolkit then you can download the attached project and copy the "WPFToolkit.dll" and "System.Windows.Controls.DataVisualization.Toolkit.dll" assemblies from this project to the bin folder of your project and add the reference.

Figure 1
After having added the reference, you will see the "System.Windows.Controls.DataVisualization.Toolkit" added to your References dialog as you see in Figure 2.
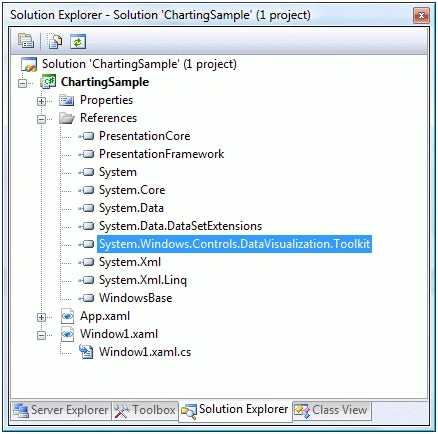
Figure 2
Now, the next step is to import the "System.Windows.Controls.DataVisualization.toolkit" and the "System.Windows.Controls.DataVisualization.Charting" namespaces to the page. When you type "xmlns=" into your page, you will see these namespaces in the Intellisense. Select and add both of them to your page as you can see in Figure 3.

Figure 3
The final reference added to the page looks like the following. As you can see here, I added the name of this reference to ToolkitRef.
xmlns:DV="clr-namespace:System.Windows.Controls.DataVisualization;assembly=System.Windows.Controls.DataVisualization.Toolkit"

xmlns:DVC="clr-namespace:System.Windows.Controls.DataVisualization.Charting;assembly=System.Windows.Controls.DataVisualization.Toolkit"
Now you will see DVC in your page and once you select it, you will notice all Charting related elements added to the Intellisense. To add a Chart control to your page, just select the Chart control from the list. The list of charting related elements looks as in Figure 4.

Figure 4
Creating a Chart in WPF
The Chart element represents a WPF Chart control in XAML.
<DVC:Chart></DVC:Chart>The code snippet in Listing 1 creates a Chart and sets its width, height, and background properties of the Chart control. The Title and LegendTitle properties represent the title of the chart and the title of the legend.
<DVC:Chart Name="mcChart"
    Width="400" Height="250"
    Background="YellowGreen"
    Foreground="DarkBlue"
    Title="Area Chart"
 LegendTitle="Month Rating" />
Listing 1
The output of Listing 1 looks as in Figure 5.

Figure 5
Chart Types in WPF
The Series attribute of the Chart element is used to create a chart type. If you see in Figure 6, you will notice BarSeries, ColumnSeries, LineSeries, PieSeries, AreaSeries and ScatterSeries attributes and based on the attribute, the chart will be created.

Figure 6
Line Chart
The code snippet in Listing 2 creates a line chart by setting Chart.Series to LineSeries. As you may see, the binding occurrs on Key and Value fields of a data source.
<DVC:Chart Canvas.Top="80" Canvas.Left="10" Name="mcChart"
    Width="400" Height="250"
 Background="LightSteelBlue">
<DVC:Chart.Series>
   <DVC:LineSeries Title=" Monthly Count"
      IndependentValueBinding="{Binding Path=Key}"
      DependentValueBinding="{Binding Path=Value}">
   </DVC:LineSeries>
</DVC:Chart.Series>
</DVC:Chart>
Listing 2
The code snippet in Listing 3 creates a collection in KeyValuePair form and sets the ItemsSource property of the chart series. The same data can be used for other chart types.
private void LoadLineChartData()
{
   ((LineSeries)mcChart.Series[0]).ItemsSource =
   newKeyValuePair<DateTime, int>[]{
   newKeyValuePair<DateTime, int>(DateTime.Now, 100),
   newKeyValuePair<DateTime, int>(DateTime.Now.AddMonths(1), 130),
   newKeyValuePair<DateTime, int>(DateTime.Now.AddMonths(2), 150),
   newKeyValuePair<DateTime, int>(DateTime.Now.AddMonths(3), 125),
   newKeyValuePair<DateTime, int>(DateTime.Now.AddMonths(4),155) };
}
Listing 3
The output looks as in Figure 7.

Figure 7
Summary
This tutorial discusses how to use WPF Toolkit to create a line chart in WPF using C#.
Rushi MehtaPosted Sep 20, 2018, 11:21 PM
Nice Article Written....!
Vinay VPosted Sep 14, 2018, 5:42 PM
Hi All ..How to draw first x axis and y axis then plot data-points accordingly with list values. I don't want to create X -Y axis (lines) with my list values . First I want to draw X and Y axis with min and max values then set/plot data-points accordingly with my list values. Please help.
Roger BretonPosted Sep 12, 2016, 11:57 AM
I don't get any output with VisualStudio2013 Pro?
Adi gopiPosted Jun 25, 2015, 9:17 AM
Can anyone tell me how to set the X,Y Minimum and maximum values plzzz
Riley HowardPosted Jun 17, 2015, 11:45 AM
I could be wrong, but it seems like your project's code example differs from that of what you provided in this tutorial. This slightly confuses me.
rin uyPosted Jan 14, 2015, 6:55 AM
hello good day, is there a way to set the independent value of a line series into the y-axis? I've searched all over the net, but I can't seem to find a way to do this. Thank you :)
kinjal patelPosted Dec 19, 2014, 12:09 AM
not supported exception for adding charting tool that cannot convert property of object type in system.windows.DependncyProperty
avinash kumarPosted Oct 30, 2013, 2:56 AM
hi mahesh i have a requirement that there should be a vertical line parallel to y axis which should be movable inside the grpah, plz give some idea..
Ganesh V SPosted Aug 21, 2013, 4:24 AM
Thanks a lot Mahesh.... :)
Jinho GnahcPosted Oct 16, 2012, 2:01 AM
Hello Mahesh, Love your tutorial! By the way, i would like to know how to plot a vertical line chart?
Sangeetha N GPosted May 14, 2012, 1:51 AM
Hi, How to plot negative values in fourth quadrant using line series chart
ashPosted Jun 18, 2011, 9:12 PM
Nice guide on getting a graph. However is there a way to get multiple lines drawn on the same graph?
sagar reddyPosted Jan 19, 2011, 7:26 AM
how to get a smooth line chart
Anand ShanbhagPosted Nov 10, 2010, 11:20 PM
The article is superbly presented, but I want some more information on how can we draw a continuously changing line graph; i.e. add points to the series inside a for loop and draw a line dynamically. Could you please suggest a method to this in WPF. I have tried a lot and failed miserably. - Anand
Ahmad NuseirPosted Jul 10, 2010, 11:20 AM
Mahesh, what if I'm reading(x,y) from a text file and i don't know how many lines are there, Please help. Thanks,
dai xiangPosted May 26, 2010, 11:02 PM
Thank you !