The Performance Counter is a Windows mechanism that allows you to capture and publish performance information about the system and your applications. The .NET Framework provides support for performance counters with a set of easy-to-use types. In addition, the Common Language Runtime (CLR) exposes its own set of predefined counters. Part 1 of this two-part article will cover the performance counters predefined by the CLR. Part 2 will show you how to publish your own custom counters.
Introduction
Performance counters enable you to monitor and analyze the behavior of physical components such as processors, disks, and memory; system objects such as processes, threads, events, mutexes, and semaphores; and even aspects of your own running applications. They can help you identify system and application bottlenecks and fine-tune system and application performance.
In this article, I will describe what a performance counter is and introduce you to the predefined counters that you can use to monitor the state of the CLR while your applications run.
What is a performance counter?
A performance counter is a single metric about some performance aspect of the system or your application. Examples include metrics such as the number of active threads in a process or the percentage of elapsed time used by threads of a process in executing instructions.
Performance counters are organized and grouped into performance counter categories. For example, the Processor category contains all counters related to the operation of the processor such as processor time, idle time, interrupt time, etc.
Windows provides myriad predefined performance counters that can be retrieved programmatically or displayed using the Performance Monitor. These counters are used to monitor the usage of operating system resources.
In the .NET world, the CLR exposes its own set of performance counters. These cover every aspect of CLR operation ranging from exception processing to security checking.
.NET CLR Performance Counters
The .NET Common Language Runtime exposes nine performance counter categories to help you monitor and tune your application's performance. The following table contains a list of these categories along with a brief description.
| Category |
Description |
| Exceptions |
Provides information about the exceptions thrown by your application. |
| Interop |
Provides information about your application's interaction with COM components, COM+ services, and type libraries. |
| JIT |
Provides information about code that has been compiled by the JIT compiler. |
| Loading |
Provides information about assemblies, classes, and AppDomains that have been loaded. |
| Locks and Threads |
Provides information about managed locks and threads used by your application. |
| Memory |
Provides information about the garbage collector. |
| Networking |
Provides information about data sent and received over the network by your application. |
| Remoting |
Provides information about remoted objects used by your application. |
| Security |
Provides information about security checks the CLR performs for your application. |
The performance counters associated with these categories are too numerous to mention in detail here. For that, I'll refer you to "Performance Counters" in the .NET Framework General Reference.
There may be other performance counter categories installed on your machine that are not mentioned in the previous table or in the .NET Framework documentation (my installation also includes a Data category for monitoring SQL Server connections.)
For those working with Web applications, ASP.NET exposes its own set of performance counters. For more information on these, see "Performance Counters for ASP.NET" in the .NET Framework Developer's Guide.
Next, I will show you how to monitor the CLR performance counters using the Performance Monitor.
Using the Performance Monitor
The Performance Monitor, PERFMON, is a system performance viewer that comes with Windows NT, Windows 2000, and Windows XP. PERFMON allows you to select counters from a list of available performance counter categories and display them either in graph, histogram, or report format.
To launch PERFMON, click Start on the taskbar and select the Run.......menu item to display the Run dialog. In the Run dialog, enter perfmon and click the OK button. You should see something similar to the following screen capture. (Shown here is how the Performance Monitor appears under Windows XP.)

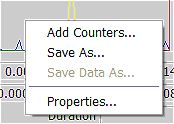
To add a counter to the Performance Monitor, click the right mouse button anywhere within the right pane. A context menu will display with the Add Counters... menu item.

Selecting Add Counters... will display the Add Counters dialog.

On this dialog you specify the computer from which performance data is to be captured. This can be the local machine or a machine on the network. You also specify the performance object of interest and the desired counters from a list of counters exposed by the object. Finally, you select the specific instances of the performance object you wish to monitor. You can choose all instances or select from a list of available instances.
Some performance objects can have at most one instance associated with them while others may have multiple instances. System and Memory are examples of performance objects that only have a single instance. (A computer can only have one system and one memory. Conversely, a processor may have multiple CPUs.)
You're probably wondering what a performance object is? This is just another moniker for performance counter category. .NET uses the term category while the Performance Monitor uses the term performance object.
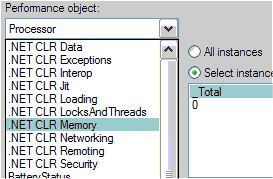
To demonstrate using the Performance Monitor, I'll run the GarbageCollectionCS sample packaged with the .NET Framework SDK. I'll begin by selecting the .NET CLR Memory performance counter category.

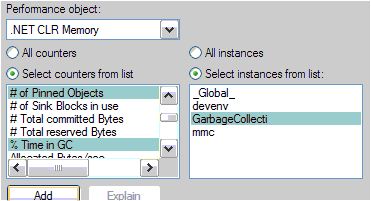
Next, I'll select # of Pinned Objects and % Time in GC. I'll also select GarbageCollectionCS as the instance to monitor.

The # of Pinned Objects indicates the number of objects in the garbage collected heap that couldn't be moved in memory. The % Time in GC indicates the percentage of elapsed time spent performing a garbage collection.
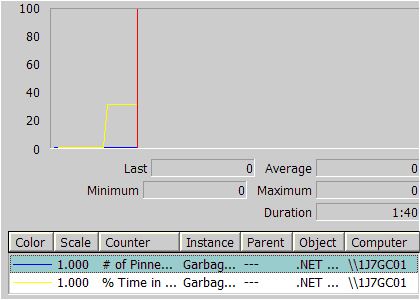
After clicking the Add button and closing the Add Counters dialog, the performance monitor will begin capturing the selected performance counter information.

That's all there is to monitoring the state of the CLR using the predefined performance counters.
Where Do We Go from Here?
We just got a brief overview of the predefined .NET CLR performance counters, and we walked through a quick demonstration of adding counters to the performance monitor.
At this point it is important to understand that the information provided by the performance counters isn't very meaningful in and of itself. Performance information must be compared against baseline metrics established for your application. Fortunately, we can also use performance counters to establish these baseline metrics.
In Part 2 of this article, I will show you how to instrument your own applications to publish custom performance counters using types provided by the Framework Class Library.