I am using the FFTW wrapper by Thomas Szalay (http://www.sdss.jhu.edu/~tamas/bytes/fftwcsharp.html).
I am able to execute the FFTW methods but I am not sure if I am properly imputing data and intrepreting the output data correctly.
I would appreciate any assistance here in reviewing what I've presented here. I probably have an input or output error.
Thank you
James
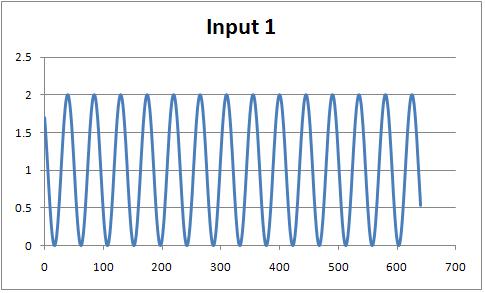
As a simple test case, my input is a modified cosine function of sampling length 640:
int n = 640;
// create two unmanaged arrays, properly aligned
IntPtr pin_1 = fftwf.malloc(n * 8);
// managed arrays, n*2 because we are dealing with complex numbers
float[] fin_1 = new float[n * 2];
// fill our arrays with a signal
for (int i = 0; i < n * 2; i += 2) //
{
fin_1[i] = (float)Math.Cos((Math.PI / 180) * (i * 4) + 0.8) + 1;
fin_1[i + 1] = 0;
}
If I understand correctly, the Real and Imaginary are input in an alternating order as shown above. And, I set the imaginary to zero.
Plotting the Real Value input looks like this:


Next I simply copy the Array of floating points to the pointer:
//copy managed arrays to unmanaged arrays
Marshal.Copy(fin_1, 0, pin_1, n * 2);
//create a test plan
IntPtr Fplan_1 = fftwf.dft_1d(n, pin_1, pin_1, fftw_direction.Forward, fftw_flags.Estimate);
// execute the test plan
fftwf.execute(Fplan_1);
// create a float array to hold the results
float[] dataOut_1 = new float[n*2];
// copy the results
Marshal.Copy(pin_1, dataOut_1, 0, n*2);
The result for the
real output of the FFT is shown below.
Again I assume that the real and imaginary components of the FFT result are in alternation order so the plot is showing dataout_1[i], where i is only even values from 0 to n*2, e.g. 0,2,4,6, etc...
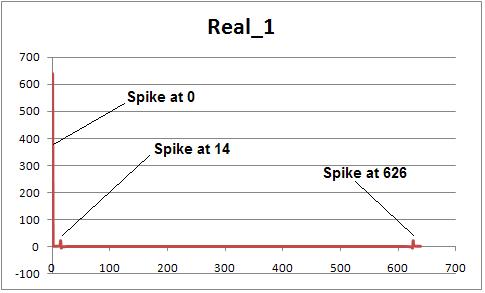
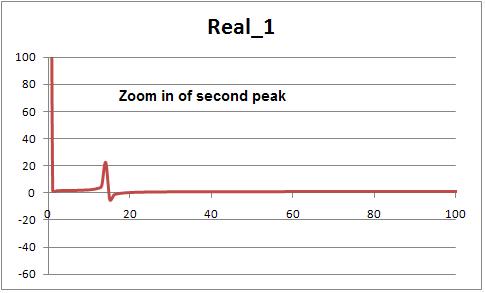
I'm don't know why I get a peak at 0, should I ignore this ?
The second peak (maximum) corresponds to the point on the X axis of 14 and it has a magnitude of 22.19 (which may have no meaning though it is similar to the calculated frequency). I interpret this to mean my predominant frequency is 14/n = 14/640 = 0.022 which correcponds to the input data (around 14 cycles per total samples (n)) .
Next, regarding the complex component of the result see the image below, where the plot is showing dataout_1[i], where i is only
odd values from 0 to n*2, e.g. 1,3,5,7
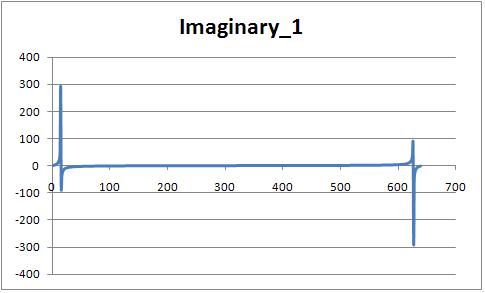
, etc...
The first peak of this plot occurs at x=14 (as in the case of the real above) and it's magnitude is 291.55.
The phase of the signal should be available from the imaginary part but I don't quite understand how to interpret it.