Introduction
This article is intended to illustrate the principles and techniques used to build reports using Reporting Services. Reports are important components of enterprise applications and are mainly used to provide a descriptive and summary view of your data in order to discover information in huge volume of data and make correct decisions. This is the principles of Business Intelligence in enterprise solutions. No matter what enterprise application you're developing, you need some way to develop a report. We've been developing reports using Crystal Reports technologies, but now we have the option to use new Microsoft Reporting technologies named Reporting Services. Reporting Services enable developing reports at the client-side as well as at the server-side.
The client-side architecture of Reporting Services is based on the client-side component (the ReportViewer) that gathers data from the data source and processes them to produce and present the reports to users. Data source is one important component to develop reports. ADO.NET DataSet is the data interface provided by Visual Studio and highly integrated with Reporting Services (client-side and server-side). The definition of the report is produced using the Report Definition Language (RDL) which is an XML-based file.
The server-side architecture of Reporting Services is a based on a server component named Reporting Server which stores the definition of the reports such as Data Sources, Parameters, etc. When the end-user needs to access to report using ReportViewer, then he connects to the Reporting Server and request for the target report. Reporting Server component connects to the underlying data source, gathers the data and bind the data to the report definition (also stored in the Reporting Server) and finally sends the output report to the ReportViewer which presents the report to the end-user. Reporting Server controls the authentication and authorization access of users to reports.
In this article, we're going to illustrate the creation of a client-side reporting application, but the same principles and techniques can be applied to the creation of server-side reporting application. The main steps to create a reporting solution are: design the report layout, define the underlying data source and finally write the code that binds the report layout and the underlying data source. When you apply these steps to Visual Studio.NET and Reporting Services in developing a report, then the development process has three steps:
- Create an ADO.NET dataset.
- Design the report layout.
- Write the code binding the dataset and report layout.
Getting started with Reporting Services and Windows Forms.
Now we're going to develop a simple reporting solution to illustrate the reporting development process. The report will show the profitability of the products in the database AdventureWorks shipped with SQL Server 2005. The underlying SQL query is shown in Listing 1.
select ProductID, [Name], [ProductNumber], StandardCost, ListPrice, ListPrice-StandardCost as Profit
from Production.Product;
Listing 1
Open Visual Studio.NET and create a Windows Forms application. Make sure the Form's width is wide enough in order to correctly display the report. Drag and drop a ReportViewer from Data in the Toolbox onto the Form design surface and leave some room to enter parameters to the report.
Now let's add a DataSet object to the project by selecting Project | Add New Item from the main menu. Then a table and table adapter to the DSProductProfitability DataSet.
Now let's add a report item by selecting Project | Add New Item (see Figure 1).
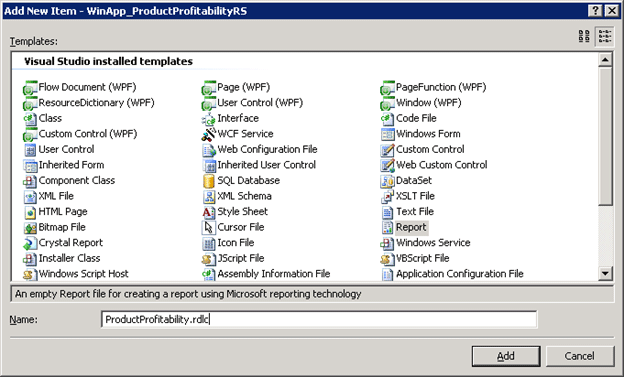
Figure 1
Now it's time to layout the report. Activate the Page Header of the Report by right-clicking on the area out of the report and selecting Page Header option. Let's add a report parameter to enter the name of the person running the report (see Figure 2).
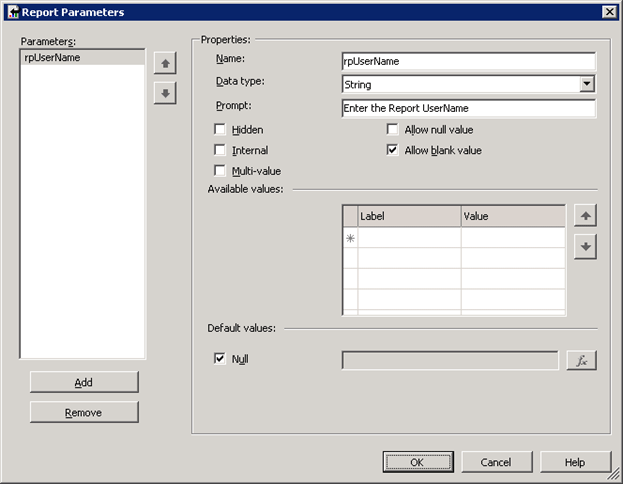
Figure 2
Now add three Textbox controls, one for displaying the Report name, other for the Organization name and a third one for the report user name. To display a report name, right-click the Textbox control and select Expression, then enter the following expression (see Listing 2).
="Username: "+Parameters!rpUserName.Value.ToString()
Listing 2
In order to construct this expression, you need to enter the first string “Username: ” and double-click on the Parameters node of the first pane, and select rpUserName parameter in the third pane.
Add a Table control to display the report as a list. Add five columns to the table, and drag-and-drop from fields from the Data Sources into the Table control (see Figure 3).
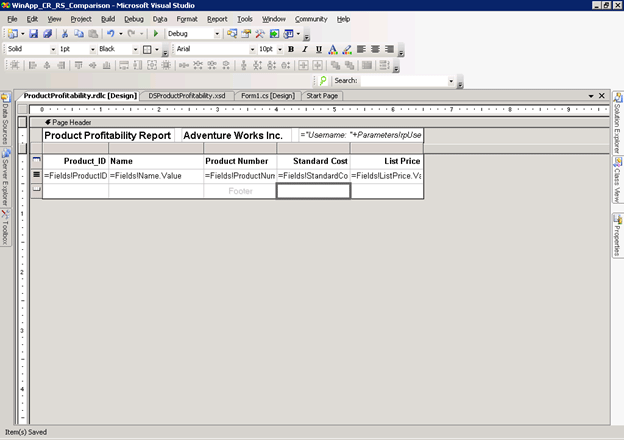
Figure 3
Let's add a grand total to the Standard Cost (see Figure 4).
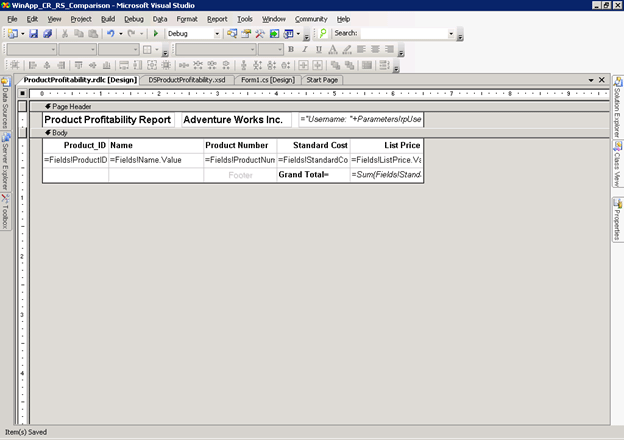
Figure 4
Now let's bind the report layout to the underlying data source. Click on the ReportViewer control and select Choose Report option and go to the ProductProfitability report.
Now let's add a Textbox control to get the user name running the report and a Button control to refresh the button. Add the following code to the Click event of the Button event (see Listing 3).
private void button1_Click(object sender, EventArgs e)
{
// TODO: This line of code loads data into the 'DSProductProfitability.Product' table. You can move, or remove it, as needed.
this.m_taProduct.Fill(this.m_dsProductProfitability.Product);
ReportParameter rpUserName = new ReportParameter();
rpUserName.Name = "rpUserName";
rpUserName.Values.Add(this.m_tbUserName.Text.Trim());
this.reportViewer1.LocalReport.SetParameters(new ReportParameter[] { rpUserName });
this.reportViewer1.RefreshReport();
}
Listing 3
Let's run the application and see the results (see Figure 5).
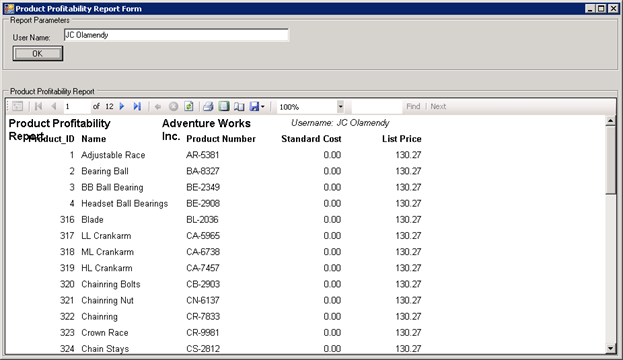
Figure 5
Conclusion
In this article, I covered the principles, methodologies and techniques to create reports using Microsoft Reporting Services technologies. You can apply these one to your own business cases.