This article has been excerpted from book "Graphics Programming with GDI+ ".
A curve is a sequence of adjoining point with a tension. The tension of a curve provides its smoothness and removes corners. A cardinal spline is a sequence of multiple joined curves. Basically, in a curve there is no straight line between two points. To illustrate, Figure 3.17 shows two curves.
There are two types of curves: open and closed. A closed curve is a curve whose starting point is the ending point. A curve that is not a closed curve is called an open curve. In Figure 3.18 the first curve is an open curve, and the second curve is a closed curve.
Drawing Open Curves
Programmatically, a curve is an array of connected point with a tension. A curve has a starting point and an ending point. Between these two points can be many intermediate points. The Graphics class provides two methods for drawing curves: DrawCurve and DrawClosedCurve. The DrawCurve method draws a curve specified by an array of Point structures. The DrawClosedCurve draws a closed curve specified by an array of point structures. Both DrawCurve and DrawClosedCurve have overloaded methods.
DrawCurve has the following overloaded forms:
public void DrawCurve (Pen, Point[]);
public void DrawCurve (Pen, PointF[]);
public void DrawCurve (Pen, Point[], float);
public void DrawCurve (Pen, PointF[], float;
public void DrawCurve (Pen, PointF[], int, int);
public void DrawCurve (Pen, Point[], int, int, float);
public void DrawCurve (Pen, PointF[], int, int, float);
The simplest form of DrawCurve is
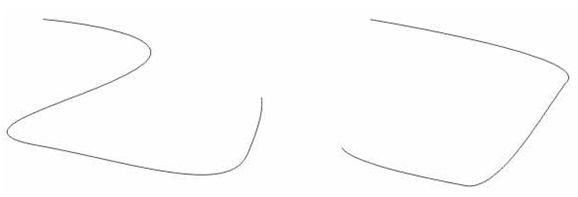
FIGURE 3.17: Two curves
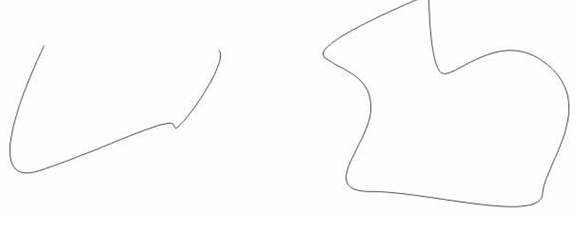
FIGURE 3.18: Open and closed curves
public void DrawCurve (Pen pen, Point[] pointer);
where points is an array of points.
To test the DrawCurve methods, we create a Windows application and add Listing 3.13 to the form's paint event handler. It creates an array of points and draws a curve using the DrawCurve method.
LISTING 3.13: Drawing a curve
private void Form1_Paint (object sender,
System.Windows.Forms.PaintEventArgs e)
{
// Create a pen
Pen bluePen = new Pen (Color.Blue, 1);
// Create an array of points
PointF pt1 = new PointF(40.0F, 50.0F);
PointF pt2 = new PointF(50.0F, 75.0F);
PointF pt3 = new PointF(100.0F, 115.0F);
PointF pt4 = new PointF(200.0F, 180.0F);
PointF pt5 = new PointF(200.0F, 90.0F);
PointF[] ptsArray =
{
pt1, pt2, pt3, pt4, pt5
};
// Draw curve
e.Graphics.DrawCurve (bluePen, ptsArray);
// Dispose of object
bluePen.Dispose();
}
Figure 3.19 shows the output from our Listing 3.13.
NOTE
The default tension is 0.5 for this overloaded version of DrawCurve.
The second form of DrawCurve is
public void DrawCurve(Pen pen, Point[] points, float tension);
Here the tension parameter determines the shape of the curve. If the value of tension is 0.0F, the method draws a straight line between the points. The value of tension should vary between 0.0F and 1.0F.
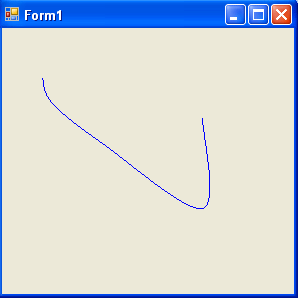
FIGURE 3.19: Drawing a curve
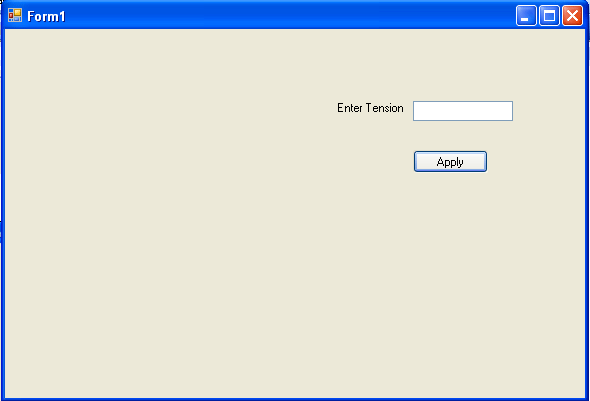
FIGURE 3.20: A curve-drawing application
Now let's update the example in Listing 3.13. We add a text box, a label, and a button to the form. We change the properties of these controls, and the form looks like Figure 3.20.
Now we will update our sample code to draw a curve using the tension value entered in the text box. We add a float type variable, tension at the class level.
private float tension = 0.5F;
Then we update the form's paint event handlers as shown in Listing 3.14. We provide tension as the third argument to the DrawCurve method.
LISTING 3.14: Drawing a curve with tension
private void Form1_Paint(object sender,
System.Windows.Forms.PaintEventArgs e)
{
// Create a pen
Pen bluePen = new Pen (Color.Blue, 1);
// Create an array of points
PointF pt1 = new PointF(40.0F, 50.0F);
PointF pt2 = new PointF(50.0F, 75.0F);
PointF pt3 = new PointF(100.0F, 115.0F);
PointF pt4 = new PointF(200.0F, 180.0F);
PointF pt5 = new PointF(200.0F, 90.0F);
PointF[] ptsArray =
{
pt1, pt2, pt3, pt4, pt5
};
// Draw curve
e.Graphics.DrawCurve (bluePen, ptsArray, tension);
// Dispose of object
bluePen.Dispose();
}
Now we add code for the Apply button, which simply reads the text box's value and sets it as the tension, as in Listing 3.15.
LISTING 3.15: The Apply button click even handle
private void ApplyBtn_Click(object sender, System.EventArgs e)
{
tension = (float) Convert.ToDouble(textBox1.Text);
Invalidate();
}
If you enter "0.0" in the text box and hit Apply, the output looks like Figure 3.21, and if you enter the value "1.0" in the text box and hit Apply the output looks like Figure 3.22.
You can also add an offset and specify a number of segments for the curve:
public void DrawCurve(Pen pen, PointF[] points, int offset, int numberOfSegments};
The offset specifies the number of elements to skip in the array of points. The first element after the skipped elements in the array of points becomes the starting point of the curve.
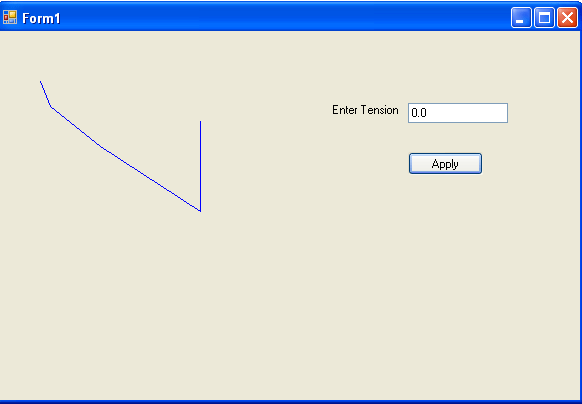
FIGURE 3.21: Drawing a curve with a tension of 0.0F
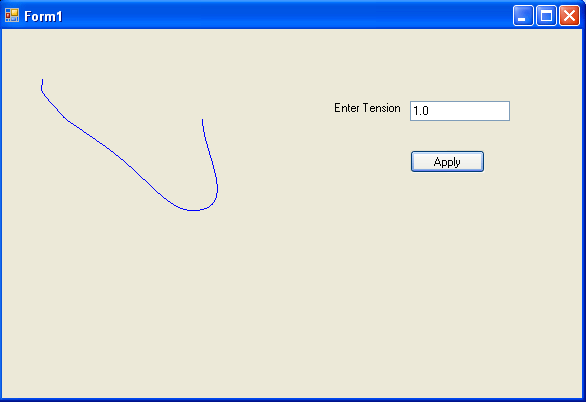
FIGURE 3.22: Drawing a curve with a tension of 1.0F
The numberOfSegments property specifies the number of segments after the starting point, to draw in the curve. It must be at least 1. The offset plus the number of segments must be less then the number of elements in the array of the points.
The following methods skips the first element of the array of points and starts drawing a curve from the second point in the array, stopping after three segments:
int offset = 1;
int segments = 3;
e.Graphics.DrawCurve (bluePen, ptsArray, offset, segments);
The final version of DrawCurve takes a pen, point array, offset, number of segments, and tension:
public void DrawCurve(
Pen pen,
Point [] points,
int offset,
int numberOfSegments,
float tension
);
Here's an example:
int offset =1;
int segments = 3;
e.Graphics.DrawCurve (bluePen, ptsArray, offset, segments, tension);
Drawing Closed Curves
As stated earlier, a closed curve is a curve whose starting and ending points are the same. The Graphics class provides the DrawCloseCurve method to draw closed curves. It has the following overloaded forms:
public void DrawClosedCurve (Pen, Point[]);
public void DrawClosedCurve (Pen, PointF[]);
public void DrawClosedCurve (Pen, Point[], float, FillMode);
public void DrawClosedCurve (Pen, Point[]F, float, FillMode);
The simplest form of DrawClosedCurve takes two parameters: a pen and an array of points. Listing 3.16 creates an array of points and a pen and calls the DrawClosedCurve method.
LISTING 3.16: Drawing closed curves
private void Form1_Paint (object sender,
System.Windows.Forms.PaintEventArgs e)
{
// Create a pen
Pen bluePen = new Pen (Color.Blue, 1);
// Create an array of points
PointF pt1 = new PointF(40.0F, 50.0F);
PointF pt2 = new PointF(50.0F, 75.0F);
PointF pt3 = new PointF(100.0F, 115.0F);
PointF pt4 = new PointF(200.0F, 180.0F);
PointF pt5 = new PointF(200.0F, 90.0F);
PointF[] ptsArray =
{
pt1, pt2, pt3, pt4, pt5
};
// Draw curve
e.Graphics.DrawClosedCurve (bluePen, ptsArray);
// Dispose of object
bluePen.Dispose();
}
Figure 3.23 shows the output from Listing 3.16. The result is a closed curve.
The second form of DrawClosedCurve takes as arguments the tension of the curve and FillMode. We have already discussed tension. FillMode specifies how the interior of a closed path is filled and clipped. The FillMode enumeration represents the fill mode of graphics object. It has two modes: Alternate (the default mode) and Winding.
As the documentation says,
To determine the interiors of a closed curve in the Alternate mode, draw a line from any arbitrary start point in the path to some point obviously outside the path. If the line crosses an odd number of path segments, the starting point is inside the closed region and is therefore part of the fill or clipping area. An even number of crossings means that the point is not in an area to be filled or clipped. An open figure is filled or clipped by using a line to connect the last point to the first point of the figure.
The Winding mode considers the direction of the path segments at each intersection. It adds one for every clockwise intersection, and subtracts one for very counterclockwise intersection. If the result is nonzero, the point is considered inside the fill or clip area. A zero counts means that the point lies outside the fill or clip area.
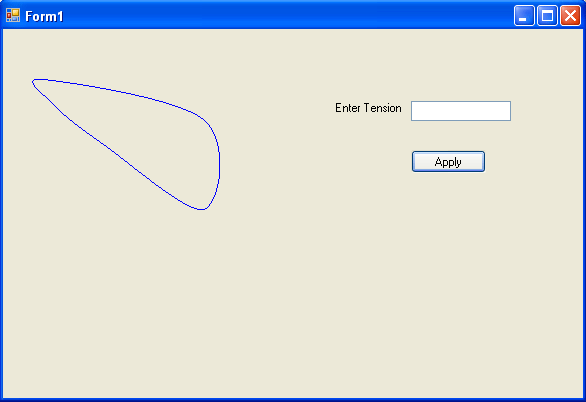
FIGURE 3.23: Drawing a closed curve
LISTING 3.17 Drawing a closed curve with a tension and fill mode.
// Draw curve
float tension = 0.5F;
e.Graphics.DrawClosedCurve (bluePen, ptsArray, tension, FillMode.Alternate);
Conclusion
Hope the article would have helped you in understanding how to draw Splines and Curves in GDI+. Read other articles on GDI+ on the website.
 |
This book teaches .NET developers how to work with GDI+ as they develop applications that include graphics, or that interact with monitors or printers. It begins by explaining the difference between GDI and GDI+, and covering the basic concepts of graphics programming in Windows. |