Introduction
All the component companies are trying to keep pace with the ever-changing landscape of the software world. Thanks to the popular Apple iPhone, the latest culture craze is the mobile phone. Google and Microsoft have both entered the market with competition to the iPhone. Microsoft's latest phone, the Windows Phone (what else would Microsoft call it?) is a contender. Component companies are scrambling to get components created for this new platform. Since the Windows Phone supports Silverlight and several companies have already written components for WPF and Silverlight, it's a no brainer to crank them out for the WP7 phone. One such company, Visifire, has returned with a powerful response unveiling a charting library that works seamlessly for the Windows Phone.
Installation and Documentation
There is no real installation per se for this library. This is fine with me because all I want to do is copy the library, add it as a reference to my project, and create my application. The download comes complete with a set of samples. The download does not seem to have any documentation, but these days all documentation is online and I easily found what I needed on Visifire's website. When I look for a component for a project these are the two questions I ask myself: 1) How thorough is the documentation for using the product? and 2) How quickly can I get answers that are not in the documentation? Visifire's site has online documentation, plenty of examples showing how to use the charts, and an active forum for answering questions.
Visifire's Sample
Although the samples were only written for WPF, I was able to copy a WPF sample into my Windows Phone project and use the code to create the same chart in Silverlight. As with any WPF app, you can create the control in dynamically in code or in XAML. The sample creates the chart completely in C# code. Below is the code for creating a simple bar chart with random heights; as you can see it is very straightforward. This is exactly how I would expect to populate a chart - minimal code, easy to understand. You can see the sample is amply commented, but you barely need the comments to understand how to create a bar chart:
Listing 1 - Creating a Visifire Chart Dynamically
|
public void CreateChart()
{
// Create a new instance of Chart
Chart chart = new Chart();
// Create a new instance of Title
Title title = new Title();
// Set title property
title.Text = "Visifire Sample Chart";
// Add title to Titles collection
chart.Titles.Add(title);
// Create a new instance of DataSeries
DataSeries dataSeries = new DataSeries();
// Set DataSeries property
dataSeries.RenderAs = RenderAs.Column;
// Create a DataPoint
DataPoint dataPoint;
for (int i = 0; i < 10; i++)
{
// Create a new instance of DataPoint
dataPoint = new DataPoint();
// Set YValue for a DataPoint
dataPoint.YValue = rand.Next(-100, 100);
// Add dataPoint to DataPoints collection.
dataSeries.DataPoints.Add(dataPoint);
}
// Add dataSeries to Series collection.
chart.Series.Add(dataSeries);
// Add chart to LayoutRoot
ContentPanel.Children.Add(chart);
}
|
I prefer initially creating the charts in XAML so I have some control over them in Blend. I was curious to see how this worked with Visifire, so I went to their website and copied the following XAML. You can actually go to Visifire's website and they have this cool little chart designer in which you can generate extract the XAML for your own purposes:
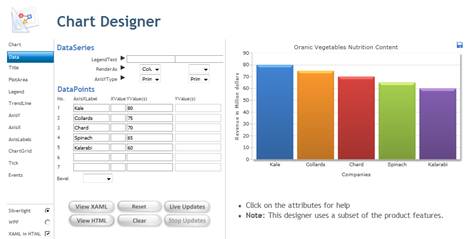
Figure 1 - Using Visifire's Online Chart Designer
The online tool generator allowed me to quickly design a bar chart and the results are shown in Listing 2:
Listing 2 - XAML Generated by Online Tool for Creating Charts
<vc:Chart xmlns:vc="clr-namespace:Visifire.Charts;assembly=SLVisifire.Charts" Width="500" Height="300" BorderThickness="0" Theme="Theme1" ToolBarEnabled="True" >
<vc:Chart.Titles>
<vc:Title Text="Organic Vegetables Nutrition Content" Enabled="True" />
</vc:Chart.Titles>
<vc:Chart.AxesX>
<vc:Axis Title="Greens" />
</vc:Chart.AxesX>
<vc:Chart.AxesY>
<vc:Axis Title="Nutritional Rating" AxisType="Primary" />
</vc:Chart.AxesY>
<vc:Chart.Series>
<vc:DataSeries RenderAs="Column" AxisYType="Primary" >
<vc:DataSeries.DataPoints>
<vc:DataPoint AxisXLabel="Kale" YValue="80" />
<vc:DataPoint AxisXLabel="Collards" YValue="75" />
<vc:DataPoint AxisXLabel="Chard" YValue="70" />
<vc:DataPoint AxisXLabel="Spinach" YValue="65" />
<vc:DataPoint AxisXLabel="Kalarabi" YValue="60" />
</vc:DataSeries.DataPoints>
</vc:DataSeries>
</vc:Chart.Series>
</vc:Chart>
I was curious to plug the XAML into my Windows Phone and check the results against what the online tool produced. Figure 2 shows the results of placing the XAML in Listing 2 inside the MainPage of the Windows Phone App, pretty much what you see in the online designer. It cut off a little bit of the chart, so I brought it up in Blend to see if I could adjust it:
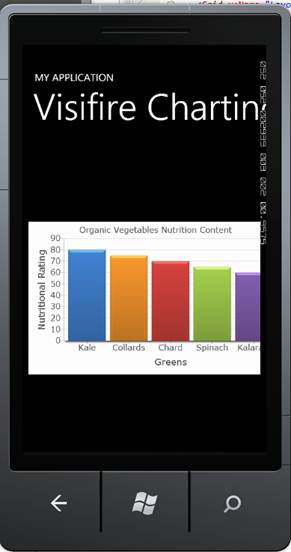
Figure 2 - Organic Vegetable Bar Chart using Visifire's online designer on WP7
It was a simple matter in Blend to get the chart adjusted to fit the phone. I just adjusted the drag points as shown in figure 3.
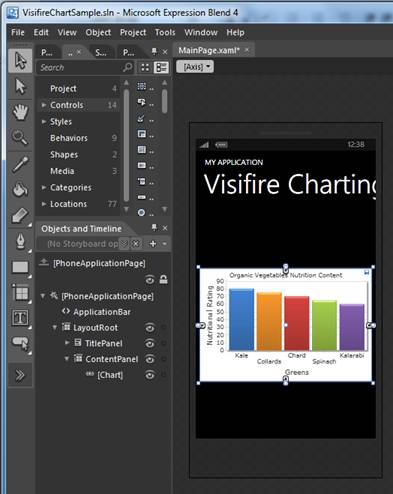
Figure 3 - Visifire's WP7 Chart Component in Blend
Now in Expression Blend, I was curious to see how easy it was to adjust the properties on the chart to create a different charting style. Visifire gives you control over many of the chart's attributes including type of interval on the chart, maximum and minimum axis values, title font and size, logarithmic vs. linear axis scaling, primary and secondary access control and other properties you would expect to be able to control in a charting component. It wasn't clear from looking at the blend properties how to go from a chart control to a pie chart. I looked at the XAML and found a property called RenderAs on the DataSeries. I changed it to PieChart and got the following results as shown in figure 4.
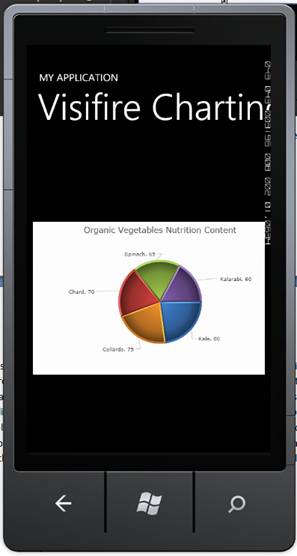
Figure 4 - Going to a pie chart in Visifire on WP7
Needless to say, it's pretty easy going from a bar chart to a pie chart in Visifire. Not to mention you can render your data as about 25 different chart types and many of those in 3D. Here is a cool 3D one to impress your client or boss. I returned to the online chart designer and chose the pyramid chart type with a 3D. Figure 5 shows the results:
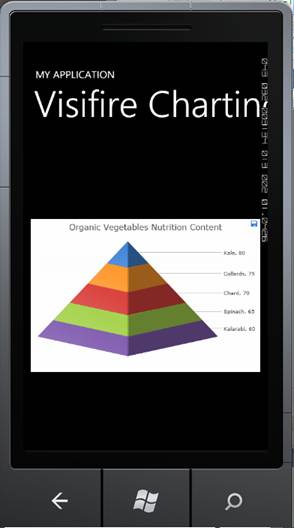
Figure 5 - 3D Pyramid chart for Organic Nutrition on WP7
Keep in mind: I have not had to crack open a manual yet to produce these charts. That is the sign of a good component—one that you can just start using out of the box. My next big question was how can I bind to different data points in MVVM through a nice ViewModel?
MVVM with Visifire
After looking over a few examples online, I was able to get the gist of how to do MVVM with Visifire, and as with everything else in the Visifire architecture it's pretty straightforward. The only tricky part is that you need to add a data mapping to your data series so that the Visifire Chart knows what pieces of data in your ViewModel to bind to for each series point. Otherwise, it's analogous to binding to an ItemsControl where the DataSource is like the ItemsSource in your ItemsControl, and the data mapping is similar to the ItemsTemplate (except the data mapping is specifically for binding to data series properties). If you are interested, Visifire has some more intricate MVVM examples on their site. In one example, they are putting the DataSeries markup into a DataTemplate and choosing the DataTemplate to bind to with a DataTemplateSelector. Clearly, the charts can handle any MVVM scenario you throw at it.
Listing 3 - Binding to a ViewModel with the Visifire Chart Component
|
<Charts:Chart x:Name="Chart1" View3D="True" Width="450" Height="300" BorderThickness="0" Theme="Theme1" ToolBarEnabled="True" Margin="0,154,0,153" d:LayoutOverrides="Width, HorizontalMargin" >
<Charts:Chart.Titles>
<Charts:Title Text="Organic Vegetables Nutrition Content" Enabled="True" />
</Charts:Chart.Titles>
<Charts:Chart.AxesX>
<Charts:Axis Title="Greens" />
</Charts:Chart.AxesX>
<Charts:Chart.AxesY>
<Charts:Axis Title="Nutritional Rating" AxisType="Primary" />
</Charts:Chart.AxesY>
<Charts:Chart.Series>
<Charts:DataSeries RenderAs="Pyramid" AxisYType="Primary" DataSource="{Binding Items}">
<Charts:DataSeries.DataMappings>
<Charts:DataMapping MemberName="AxisXLabel" Path="Label"></Charts:DataMapping>
<Charts:DataMapping MemberName="YValue" Path="YValue"></Charts:DataMapping>
</Charts:DataSeries.DataMappings>
</Charts:DataSeries>
</Charts:Chart.Series>
</Charts:Chart>
|
The ViewModel for my organic vegetable example contains a list of ChartItemViewModels that I specifically created for holding the nutrition data of my healthy greens.
Listing 4 - View Model for Nutrition Data of Healthy Greens
|
using System.Collections.ObjectModel;
namespace VisifireChartSample.ViewModel
{
public class ChartViewModel
{
public ObservableCollection<ChartItemViewModel> Items { get; set; }
public ChartViewModel()
{
Items = new ObservableCollection<ChartItemViewModel>();
Items.Add(new ChartItemViewModel{Label="Kale", YValue=80});
Items.Add(new ChartItemViewModel { Label = "Kale", YValue = 75 });
Items.Add(new ChartItemViewModel { Label = "Collards", YValue = 70 });
Items.Add(new ChartItemViewModel { Label = "Chard", YValue = 65 });
Items.Add(new ChartItemViewModel { Label = "Spinach", YValue = 60 });
}
}
}
|
Note that the ChartItemViewModel that is added to our collection of data points implements INotifyPropertyChanged. This allows it to update the chart when a data point has changed in the view model.
Listing 5 - Chart View Model Item Class
|
using System;
using System.ComponentModel;
namespace VisifireChartSample.ViewModel
{
public class ChartItemViewModel : INotifyPropertyChanged
{
public String Label
{
get { return _label; }
set
{
_label = value;
PropertyChanged(this, new PropertyChangedEventArgs("Label"));
}
}
public Double YValue
{
get { return _yValue; }
set
{
_yValue = value;
PropertyChanged(this, new PropertyChangedEventArgs("YValue"));
}
}
#region INotifyPropertyChanged Members
public event PropertyChangedEventHandler PropertyChanged = delegate { };
#endregion
private Double _yValue;
private String _label;
}
}
|
Conclusion
Visifire's charting passed the test of what I consider a good charting tool. In fact, they surpassed my expectations by providing an online designer and code generation tool to create the XAML for any kind of chart you might want to create. In reviewing the product for the phone I really can't offer any criticsm. Visifire's charting produces clean, visually appealing charts and it takes no time to implement the feature set in Silverlight. It also conforms well to Silverlight's MVVM model. That said, a single developer license for Visifire with support is $499.00. Without support it is $399. I was curious to see what you get for the extra $100.00. Apparently, quite a bit, so it sounds like it's worth the extra $100.00. Support even includes remote troubleshooting, which I rarely hear of for a product in this price range. So if you need to light a fire under your chart design for the windows phone, take a look at the Visifire component toolset, it will certainly breathe life into the presentation of the data in your app.