Debugging, Tracing and Instrumentation in .NET and ASP.NET (14 FAQ)
Contents
So, what's the agenda?
What is Instrumentation?
What is debugging and tracing?
How can we implement debugging and tracing in ASP.NET ?
How do we view the results of debug and trace?
So can we see a quick sample of how tracing information can be viewed?
What if we want to enable tracing in all pages?
Is it possible to do silent tracing, rather than displaying on the browser?
How do I persist the instrumented information?
There is too much noise can we only see information which we need?
All the above methodologies are for web, how can we do tracing for windows?
Can we emit different types of trace events like critical, warning, error etc?
Can we control what kind of information can be routed?
How can switch off instrumentation?
It would great if we can summarize?
References
Source code
Diagnosing a software application is an art and this art has to be more skillful when in production. In the development environment you have the complete VS IDE tool so diagnosing is much easier. In a production environment as a best practice you do not install Visual Studio IDE. So in production it's like fighting with a Lion without a knife.
This article has a three point agenda.
• We will first start with understanding some basic vocabularies like debug, trace and instrumentation.
• Once we understand the vocabularies we will see how to use the trace attribute to tracing in ASP.NET. We will also understand some drawbacks of the same.
• We will then try to remove those drawbacks using the full tracing framework which comes as a part of the "System.Diagnostic" namespace. In the tracing framework we will try to understand the trace object, switches and listeners.
You can watch my .NET interview questions videos on various sections like WCF, Silver light, LINQ, WPF, Design patterns, Entity framework etc.
Debugging an application is not just about pressing F10 or F11 and watching "add watch windows" using Visual Studio IDE. Debugging becomes pretty complex in production environments where the project is deployed in a release mode and you need to figure out at what point the code ran and when did it crash. The worst part is you are enjoying your sleep at home and suddenly someone calls up and says, "Hey! the application crashed in production".
If your application is well planned with proper instrumentation you can just tell the person to view the event viewer or a log file for further details and you can give the solution on the phone.
So defining instrumentation in short, it's the ability of the application to monitor execution path at critical points to do debugging and measure performance.

We would like to enable application instrumentation in two situations while you are doing development and while your application is in production. When you monitor application execution and performance in a development stage it is called "Debugging" and when you do it in a deployed environment it's termed as 'Tracing'.
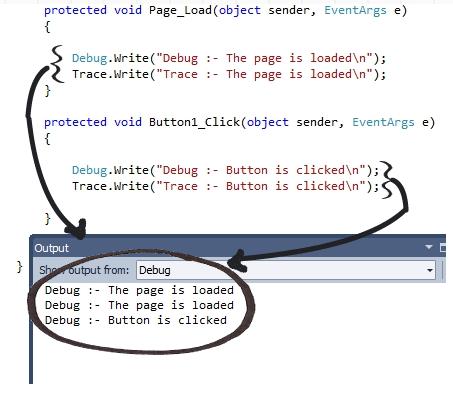
Debugging and tracing can be implemented by importing 'System.Diagnostic' namespace and by calling 'Debug' and 'Trace' methods as shown in the code below. In the code below we are tracking critical execution points like page load and button click.
protected void Page_Load(object sender, EventArgs e)
{
Debug.Write("Debug :- The page is loaded\n");
Trace.Write("Trace :- The page is loaded\n");
}
protected void Button1_Click(object sender, EventArgs e)
{
Debug.Write("Debug :- Button is clicked\n");
Trace.Write("Trace :- Button is clicked\n");
}
As said previously, debug is meant for enabling instrumentation in the development phase while tracing helps during execution. During development VS IDE tool is the best medium of viewing debug information and during execution the mediums can be a browser, event viewers, file system etc.
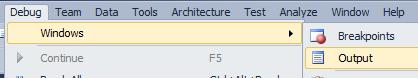
In order to see debug information execute the project, click on debug, windows and click on output menu as shown in the figure below.
You should be able to see the output information in output windows as shown in the figure below.
As debug code is not shipped in production you will not be able to see the debug information when your application goes live. As said previously, tracing information is seen when you execute the project in production mode or go live mode. Tracing information can be viewed by on various mediums:-
• By the user interface (Web browser or the windows UI)
• Event viewer
• Log file, format can be XML, CSV etc.
• In ASP.NET you can also view by using Trace.axd
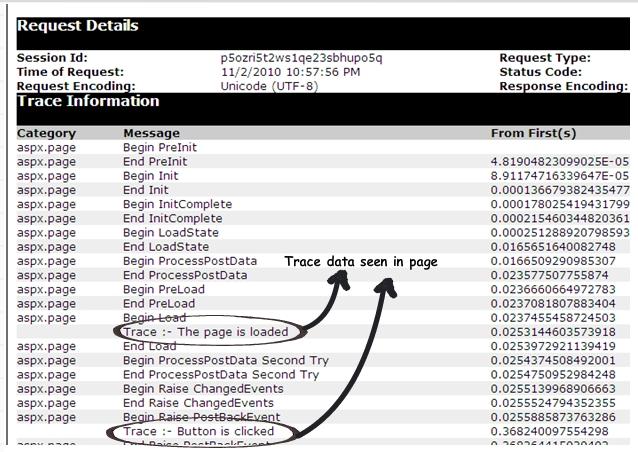
A quick and dirty way of seeing tracing information is by going to the ASPX front code and put trace=true in the 'Page' attribute.
<%@ Page Language="C#" AutoEventWireup="true" trace="true"
 CodeBehind="Default.aspx.cs" Inherits="WebTracing._Default" %>
Once you have done the same you should be able to see tracing information as shown in the figure below. With trace enabled it also displays a lot of other things like different page events, session data, hidden field data, http headers etc. I have circled the custom information which we have written using the 'Trace' object.
If you want to enable tracing in all pages, you need to enable trace in the 'web.config' file as shown in the below code snippet.

<system.web>
<trace enabled="true" pageOutput="true" requestLimit="40" localOnly="false"/>
</system.web>
In actual production it will not be a good idea to enable the trace using the above two methodologies as the end user can view your tracing information on the browser. So the next logical question is how we silently trace the same.
In order to background silent tracing we need to go to the web.config file and in the trace tag enter pageoutput=false. By setting "pageoutput" to false we say the trace engines do not send messages to browser and instead collect them in memory.
<system.web>
<trace enabled="true" pageOutput="false" requestLimit="40"
localOnly="false"/>
</system.web>
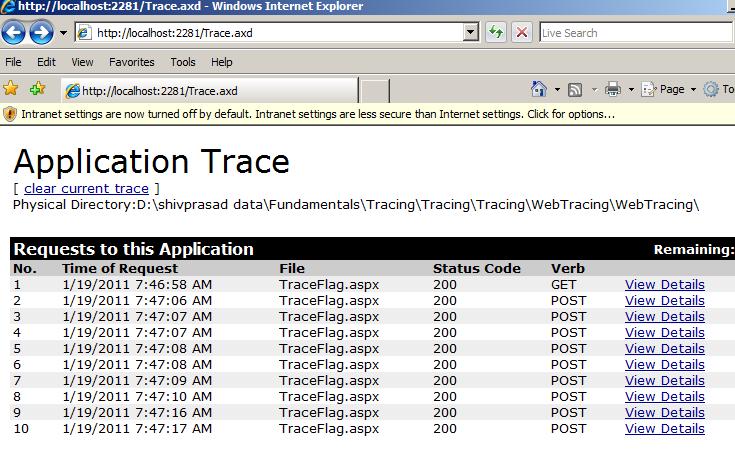
This in-memory stored instrumentation data can be viewed using Trace.axd by typing url http://localhost:2281/Trace.axd. Below is a sample screen shot which shows how the data looks. If you click on the view details you can see the tracing information.
When we instrument using debug attribute either using page or AXD extension they are not persisted. In other words they are displayed on the browser temporarily.
Most of the times we would like to persist the information in a file, event viewer etc so that we can later see the history for proper diagnosis.
We need to enable the 'writetoDiagnosticsTrace' attribute to true. When this attribute is set to true the information is sent to a listener.
<trace enabled="true" requestLimit="10" localOnly="false"
 writeToDiagnosticsTrace="true" pageOutput="false"/>
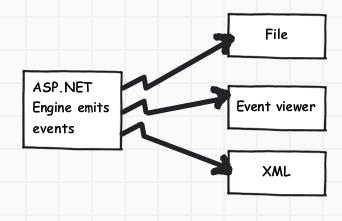
You can then define various types of listeners like text file listener, event viewer etc. Below is a sample code snippet of how the listeners actually look. So the ASP.NET tracing engine will emit diagnosis information which will be then caught and routed to the proper source by the listener.
<system.diagnostics>
<trace autoflush="true">
<listeners>
<clear/>
<add name="textwriterListener" type="System.Diagnostics.TextWriterTraceListener"
  initializeData="c:\outfile.txt" traceOutputOptions="ProcessId, DateTime"/>
</listeners>
</trace>
</system.diagnostics>
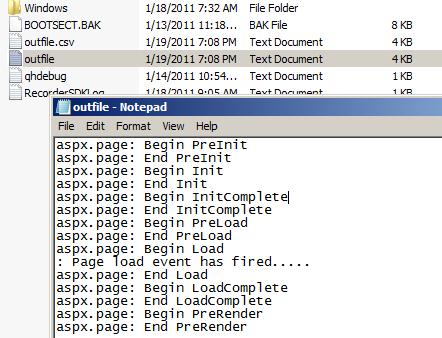
Below is a simple snapshot of how instrumented data is captured.

When we use the trace attribute it emits out all the events of the page. Sometimes these events can hinder your diagnosis.
If you want to eliminate all ASP.NET events and just concentrate on your message then we need to add a source. We need to then write the messages on the source and the source will redirect the same to the trace listeners.
In order to define a source go to your web.config and in the "system.diagnostics' tag enter the "source' tag as shown in the code snippet below. In the code snippet below we have defined the source name as "myTraceSource". Inside the source we can define various listeners.
<system.diagnostics>
<sources>
<source name="myTraceSource" switchName="mySwitch"
 switchType="System.Diagnostics.SourceSwitch">
<listeners>
<!-… Define all your listeners in this place ..>
</listeners>
</source>
</sources>
</system.diagnostics>
Below is a complete sample code snippet with listeners defined inside the source.
<system.diagnostics>
<sources>
<source name="myTraceSource" switchName="mySwitch"
  switchType="System.Diagnostics.SourceSwitch">
<listeners>
<clear/>
<add name="textwriterListener"
 type="System.Diagnostics.TextWriterTraceListener"
 initializeData="c:\outfile.txt" traceOutputOptions="ProcessId, DateTime"/>
</listeners>
</source>
</sources>
</system.diagnostics>
In order to send messages to the trace source using C# code first we need to import namespace "System.Diagnostics" as shown in the below code snippet.
using System.Diagnostics;
Once the namespace is imported we can then send messages on any event by creating the "TraceSource" object and calling "TraceEvent" as shown in the below code snippet.
TraceSource obj = new TraceSource("myTraceSource");
obj.TraceEvent(TraceEventType.Error, 0, "This is a error message");
obj.Close();It's the same way; define the source and listeners in your app.config file, create the tracesource object and call traceevent method to write the same to the listeners.
We would like to emit different kinds of messages from the application like critical messages, error message or just information. The types of messages can be defined by using "TraceEventType" enum as shown in the code snippet below.
obj.TraceEvent(TraceEventType.Critical, 0, "This is a critical message");
obj.TraceEvent(TraceEventType.Warning, 0, "This is a simple warning message");
obj.TraceEvent(TraceEventType.Error, 0, "This is a error message");
obj.TraceEvent(TraceEventType.Information, 0, "Simple information message");
obj.TraceEvent(TraceEventType.Verbose, 0, "Detail Verbose message");
Sometime we would like to control the kind of diagnosis information we see. This can be achieved by using the switch tag in config file.
<system.diagnostics>
....
....
....
<switches>
<add name="mySwitch" value="1"/>
</switches>
</system.diagnostics>
You can define various values depending on what kind of diagnose information you want to record.
| Value |
Type of message |
| Critical = 1 |
Fatal error or application crash. |
| Error = 2 |
Recoverable error. |
| Warning = 4 |
Noncritical problem. |
| Information = 8 |
Informational message. |
| Verbose = 16 |
Debugging trace. |
| Start = 256 |
Starting of a logical operation. |
| Suspend = 1024 |
Suspension of a logical operation. |
| Stop = 512 |
Stopping of a logical operation. |
| Resume = 2048 |
Resumption of a logical operation. |
| Transfer = 4096 |
Changing of correlation identity. |
You can then attach the switch to the source.
<source name="myTraceSource" switchName="mySwitch"
switchType="System.Diagnostics.SourceSwitch">
Set the switch value to zero.
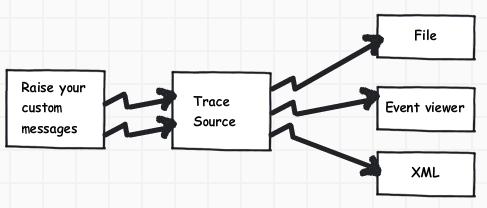
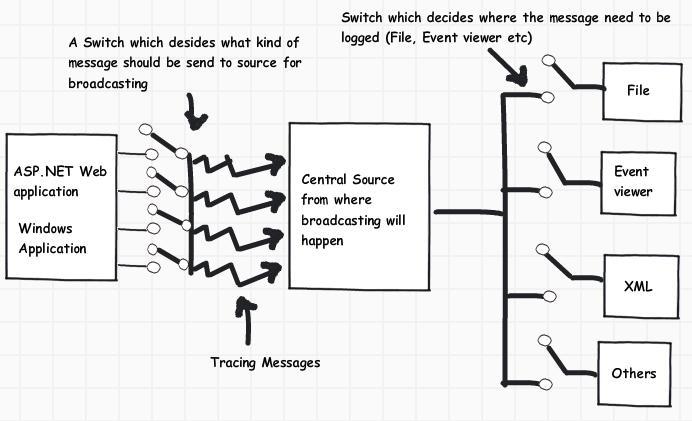
Summarizing ASP.Net or Windows application emits tracing information to the trace source; these messages can be controlled by switches and sent to various sources (file, event viewer, xml etc) which are defined using trace listeners. The following figure summarizes the complete tracing framework visually.
15 Seconds Tracing in .NET and Implementing Your Own Trace Listeners
BCL Team Blog A Tracing Primer - Part I [Mike Rousos]
Cutting Edge A Provider-Based Service for ASP.NET Tracing
How to Configure Trace Switches
Viewing diagnostics trace info in an ASP.NET Website - Alex Thissen Weblog Build 1.15.10.1971
Walkthrough Integrating ASP.NET Tracing with System.Diagnostics Tracing
With the article we have also provided the source. The source code demonstrates:-
• Trace attribute
• Enabling trace using web.config file
• Tracing in windows application
Trace listeners, switch and trace source.