Introduction
I know many will not like my Interview questions article. Some may think its bad for various reasons and some may think its good for quick revision. Again I repeat you do not get jobs by reading interview question and answers , but yes it definitely serves as a quick reference. So looking at the good part I continue my Interview questions and answers series. This time I will be writing from process point of view. Six sigma is a getting good recognition in the market and I am sure many professionals are asked questions on the same. So below is a quick revision which will give you a decent understanding of Six sigma from interview point of view.
(B) What is six sigma?
Sigma is a statistical measure of variation in a process. We say a process has achieved six sigma if the quality is 3.4 DPMO (Defect per Million opportunities). It's a problem solving methodology that can be applied to a process to eliminate the root cause of defects and costs associated with the same.
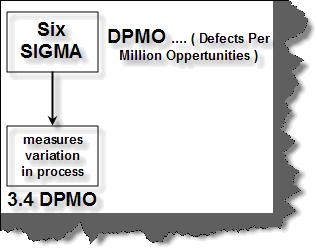
Figure: - Six Sigma.
(I) Can you explain the different methodology for execution and design process in SIX sigma?
The main focus of SIX sigma is on reducing defects and variations in the processes. DMAIC and DMADV are the models used in most SIX sigma initiatives. DMADV is model for designing process while DMAIC is for improving the process.
DMADV model has the below five steps:-
- Define: - Determine the project goals and the requirements of customers (external and internal).
- Measure: - Assess customer needs and specifications.
- Analyze: - Examine process options to meet customer requirements.
- Design: - Develop the process to meet the customer requirements.
- Verify: - Check the design to ensure that it's meeting customer requirements
DMAIC model has the below five steps:-
- Define the projects, the goals, and the deliverables to customers (internal and external). Describe and quantify both the defect and the expected improvement.
- Measure the current performance of the process. Validate data to make sure it is credible and set the baselines.
- Analyze and determine the root cause(s) of the defects. Narrow the causal factors to the vital few.
- Improve the process to eliminate defects. Optimize the vital few and their interrelationships.
- Control the performance of the process. Lock down the gains.
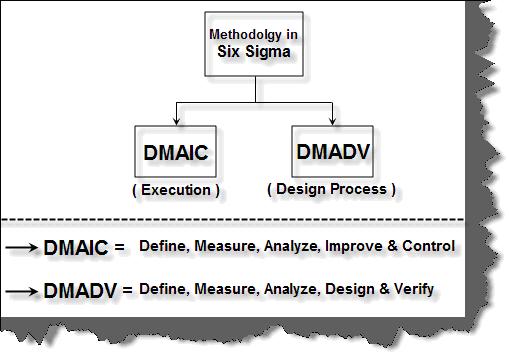
Figure: - Methodology in SIX Sigma
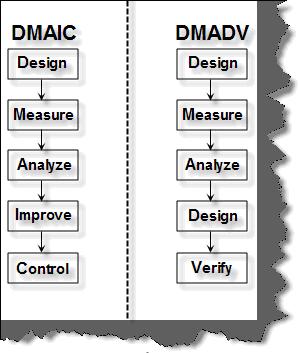
Figure: - DMAIC and DMADV
(I) What does executive leaders, champions, Master Black belt, green belts and black belts mean?
SIX sigma is not only about techniques, tools and statistics, but the main thing depends upon people. In SIX sigma there five key players:-
- Executive leaders
- Champions
- Master black belt
- Black belts
- Green belts
Let's try to understand all the role of players step by step.
Executive leaders: - They are the main person who actually decides that we need to do SIX sigma. They promote it throughout organization and ensure commitment of the organization in SIX sigma. Executive leaders are the guys who are mainly either CEO or from the board of directors. So in short they are the guys who fund the SIX sigma initiative. They should believe that SIX sigma will improve the organization process and that they will succeed. They should be determined that they ensure resources get proper training on SIX sigma, understand how it will benefit the organization and track the metrics.
Champions: - Champion is a normally a senior manager of the company. He promotes SIX sigma mainly between the business users. He understand SIX sigma thoroughly , serves as a coach and mentor , selects project , decides objectives , dedicates resource to black belts and removes obstacles which come across black belt players. Historically Champions always fight for a cause. In SIX sigma they fight to remove black belt hurdles.
Master Black-Belt: - This role requires highest level of technical capability in SIX sigma. Normally organizations that are just starting up with SIX sigma will not have the same. So normally outsiders are recruited for the same. The main role of Master Black belt is to train, mentor and guide. He helps the executive leaders in selecting candidates, right project, teach the basic and train resources. They regularly meet with black belt and green belt training and mentor them.
Black-Belt: - Black belt leads a team on a selected project which has to be show cased for SIX sigma. They are mainly responsible to find out variations and see how these variations can be minimized. Mast black belt basically selects a project and train resources, but black belt are the guys who actually implement it. Black belt normally works in projects as team leads or project manager. They are central to SIX sigma as they are actually implementing SIX sigma in the organization.
Green Belt: - Green belt assist black belt in their functional areas. They are mainly in projects and work part time on SIX sigma implementation. They apply SIX sigma methodologies to solve problems and improve process at the bottom level. They have just enough knowledge of SIX sigma and they help to define the base of SIX sigma implementation in the organization. They assist black belt in SIX sigma implementation actually.
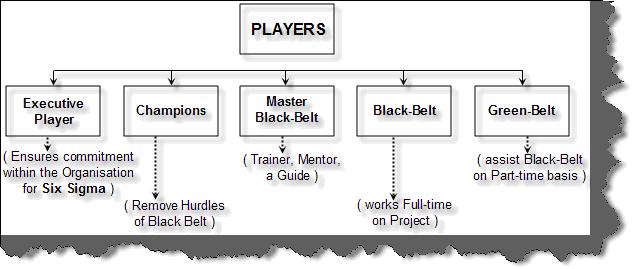
Figure: - SIX key players
(I) What are the different kinds of variations used in six sigma?
Variation is the basis of six sigma. It defines how much changes are happening in an output of a process. So if a process is improved then this should reduce variations. In six sigma we identify variations in the process, control them and reduce or eliminate defects. Now let's understand how we can measure variations.
There are four basic ways of measuring variations Mean, Median, Mode and Range. Let's understand each of these variations in more depth for better analysis.
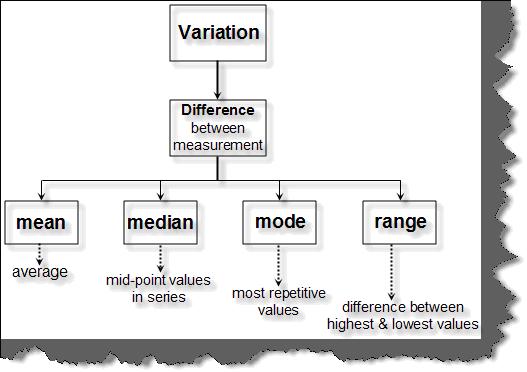
Figure: - Different variations in Six sigma
Mean: - In mean the variations are measured and compared using math's averaging techniques. For instance you can see the below figure which shows two weekly measures of how many computers are manufactured. So for that we have tracked two weeks one we have named as Week 1 and the other as Week 2. So to calculate variation by using mean we calculate the mean of week1 and week2. You can see from the calculations below we have got 5.083 for week and 2.85 for week2. So we have a variation of 2.23.
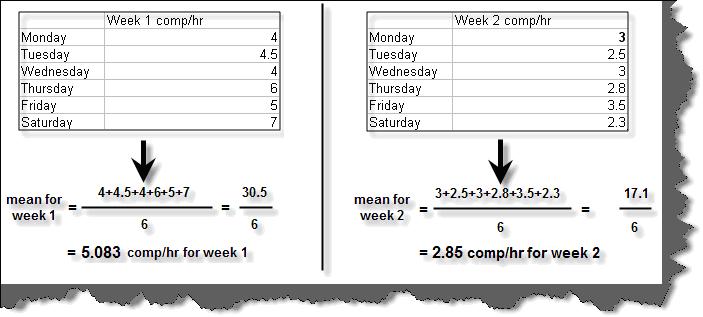
Figure: - Measuring variations by using Mean
Median: - Median value is a mid point in our range of data. Mid point can be found out using by finding the difference between highest and lowest value then divide it by two and finally add the lowest value to the same. For instance for the below figure in week1 we have 4 as the lowest value and 7 as the highest value. So first we subtract the lowest value from the highest value i.e. 7 -4. Then we divide it by two and add the lowest value. So for week1 the median is 5.5 and for week2 the median is 2.9. So the variation is 5.5 - 2.9.
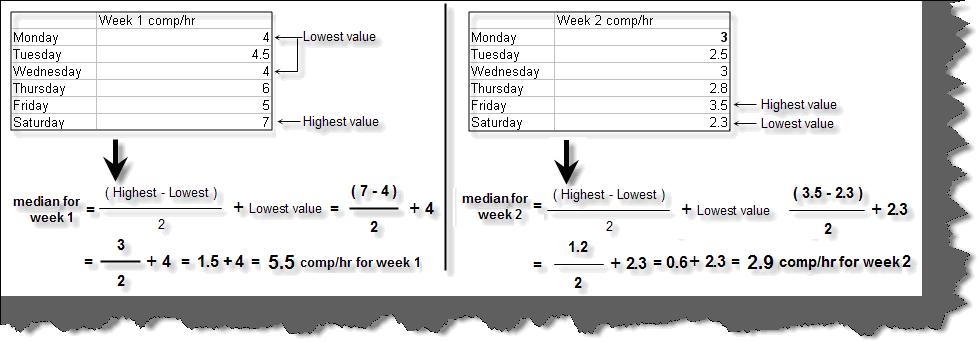
Figure: - Median for calculating variations
Range: - Range is nothing but spread of value for a particular data range. In short it is the difference between highest and lowest values in particular data range. For instance you can see for recorded computer data of two week we have found out the range values by subtracting the highest value from the lowest.
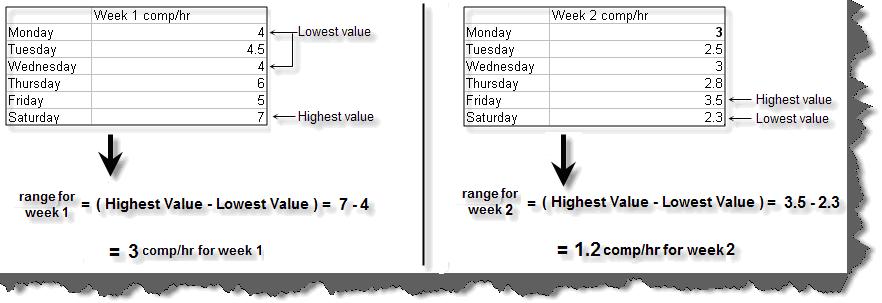
Figure: - Range for calculating variations
Mode: - Mode is nothing but the most occurred values in a data range. For instance in our computer manufacturing data range 4 is the most occurred value in Week1 and 3 is the most occurred value in week 2. So the variation is 1 between these data ranges.
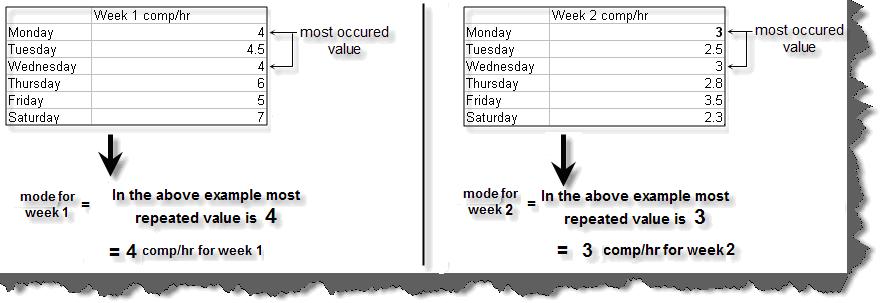
Figure: - Mode for calculating variations
(A) Can you explain the concept of standard deviation?
The most accurate method of quantifying variation is by using standard deviation. It indicates the degree of variation in a set of measurement or a process by measuring the average spread of data around the mean. It's but complicated than the deviation process discussed in the previous question, but it does give accurate information.
Note: - To understand standard deviation we will be going through a bit of maths so please co-operate and keep your head cool. In the below steps we will go step by step and understand how we can implement standard deviation.
Below is the formula for Standard deviation. "σ" symbol stands for standard deviation. X is the observed values; X (with the top bar) is the arithmetic mean and n is the number of observations. The formulae must be looking complicated by but let's break up in to steps and understand it better.
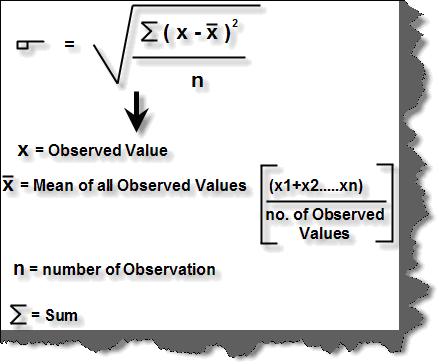
Figure: - Standard deviation formulae
The first step is to calculate the mean. This can be calculated by adding all the observed values and dividing the same by the number of observed values.
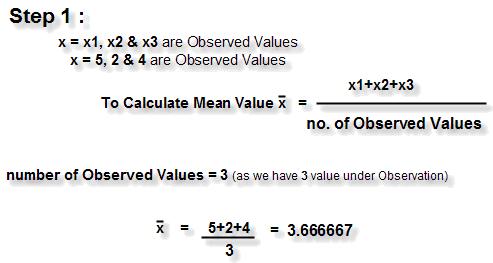
Figure: - Step 1 Standard deviation
The second step is to subtract the average from each observation, square them and then sum them. Because we square them we will not get negative values. Below figure indicates the same in very detail manner.
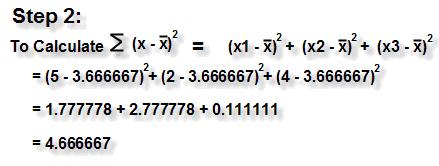
Figure: - Step 2 Standard deviation
In the third step we divide the same with the number of observations as shown the figure.
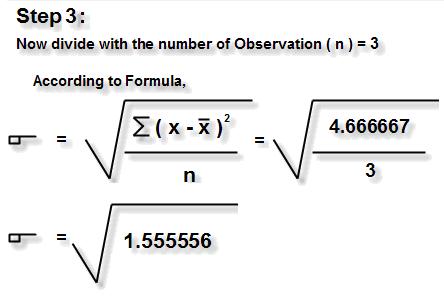
Figure: - Step 3 Standard deviation
In the final step we take the square root which gives the standard deviation.
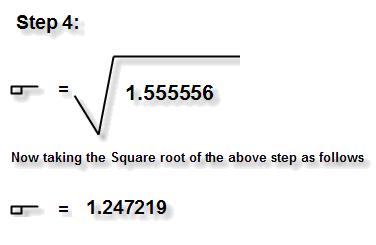
Figure: - Step 4 standard deviation
Note: - Below are some questions which we have not answered and left it as an exercise to the readers. We will definitely try to cover the same in the coming second edition.
(B) Can you explain the concept of fish bone/ Ishikawa diagram?
There are situations where we need to analyze what caused the failure or problem in a project. Fish bone or Ishikawa diagram is one of the important concept which can help you list down your root cause of the problem. Fish bone was conceptualized by Ishikawa, so in the honor of its inventor this concept was named as Ishikawa diagram. Inputs to conduct a fish bone diagram comes from discussion and brain storming with people who were involved in the project. Below figure shows how the structure of the Ishikawa diagram is.
Below is a sample fish bone diagram. The main bone is the problem which we need to address and to know what caused the failure. For instance the below fish bone is constructed to know what caused the project failure. To know this cause we have taken four main bones as inputs Finance, Process, People and Tools. For instance on the people front there are many resignations - this was caused because there was no job satisfaction - this was caused because the project was a maintenance project. In the same way causes are analyzed on the Tools front also. In tools - No tools were used in the project - because no resource had enough knowledge about the same - this happened because of lack of planning. In process front the process was adhoc - this was because of tight dead lines - this was caused because marketing people over promised and did not negotiate properly with the end customer.
Now once the diagram is drawn the end bones of the fish bone signify the main cause of project failure. From the below diagram here's a list:-
- No training was provided for the resources regarding tool.
- Marketing people over promised with customer which lead to tight dead lines.
- Resources resigned because it's a maintenance project.
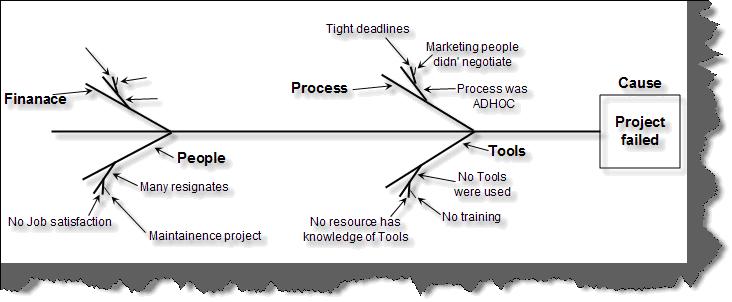
Figure: - Fish bone / Ishikawa diagram
(B) What is Pareto principle?
Pareto principle also paraphrased as 80/20 principle is simple effective problem tackling way in management. It says that 20% of your problems lead to other 80 % of problems. So rather than concentrating on the 80% of problem if you concentrate on 20% of problems you can save lot of trouble. So in Pareto you analyze the problems and only concentrate on 20% of your vital problems.
If you look at the above fish bone diagram we have discussed all the root problem is due to only three reasons:-
- No tools are used.
- No process is defines.
- Many resignations.
So if we tackle these problems we can solve all the other problems.
(A) Can you explain QFD?
(A) Can you explain FMEA?
(A) Can you explain X bar charts?
(A) Can you explain Flow charting and brain storming?